
Chandeliers
Un indicateur MTF qui reconnaît certaines configuration de chandeliers
Il est en cours de dévoppement
A vous de tester
J'avais promis de fournir un indicateur de ce genre dans un des post de ce site.
Chandeliers Japonais
Modérateur : Administrateurs
Chandeliers Japonais
- Pièces jointes
-
- Pattern_Recognition.mq4
- (16.13 Kio) Téléchargé 372 fois
Mon blog : FXprotechnics

-
DMTrading

- Professionnel certifié
- Messages : 544
- Inscription : 15 nov. 2010, 16:45
- Localisation : Monaco - Vilnius - Sofia
Chandeliers Japonais: Formation, Discussions et Analyses
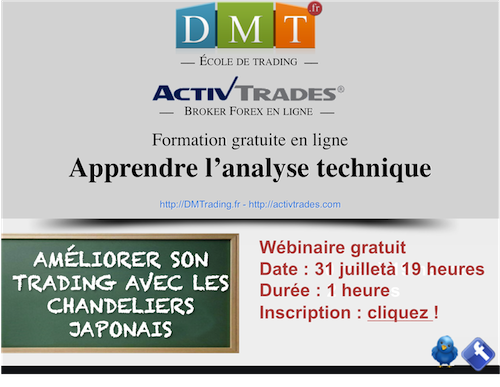
Nous avons le plaisir de vous inviter à notre prochain wébinaire gratuit en partenariat avec notre broker ActivTrades PLC.
"AMÉLIORER SON TRADING AVEC LES CHANDELIERS JAPONAIS"
CE SOIR À 19 HEURES
Contenu : contrairement au chartisme très voisin des chandeliers, ces derniers ont une réelle utilité dans l'analyse et le trading. Etudions cela de près !
S'INSCRIRE
Tous nos wébinaires sont enregistrés et archivés en ligne et consultables ici.
Derniers wébinaires archivés :
#1 - Interpréter le prix avec le CCI et les moyennes mobiles
#2 - Amérliorer son trading avec les bandes de Bollinger
#3 - La représentation graphique en Renko
#4 - La théorie de Dow et l'analyse à UT multiples
#5 - Stratégie de trading sur le USD/HKD
#6 - Breakout du matin sur EUR/USD
#7 - Positionnement du Stop Loss
#8 - Idées reçues sur le trading et l'analyse technique
#9 - Stratégie de trading basée sur les moyennes mobiles
#10 - Améliorer son trading avec les supports et résistances
#11 - Améliorer son trading avec les chandeliers japonais
http://dmtrading.fr


- Formation gratuite pour débuter (15h) : sur YouTube
- Tweets de Pascal (trade en live, photos...) : https://twitter.com/TouringFXTrader
- Suivi trading de position sur le blog de Pascal : http://thetouringtrader.com/
- Formation gratuite pour débuter (15h) : sur YouTube
- Tweets de Pascal (trade en live, photos...) : https://twitter.com/TouringFXTrader
- Suivi trading de position sur le blog de Pascal : http://thetouringtrader.com/
-
DMTrading
- Professionnel certifié
- Messages : 544
- Inscription : 15 nov. 2010, 16:45
- Localisation : Monaco - Vilnius - Sofia
Re: Améliorer son trading avec les chandeliers japonais
http://dmtrading.fr
- Formation gratuite pour débuter (15h) : sur YouTube
- Tweets de Pascal (trade en live, photos...) : https://twitter.com/TouringFXTrader
- Suivi trading de position sur le blog de Pascal : http://thetouringtrader.com/
- Formation gratuite pour débuter (15h) : sur YouTube
- Tweets de Pascal (trade en live, photos...) : https://twitter.com/TouringFXTrader
- Suivi trading de position sur le blog de Pascal : http://thetouringtrader.com/
Chandeliers Japonais : peut-on s'en passer
Bonjour, je débute dans le trading et je me pose quelques questions  . J'ai lu beaucoup d'analyses techniques qui se servent de chandeliers japonais. c'est vrais qu'il y a des sites qui expliquent comment les lire mais moi je suis visuel
  et j'ai du mal a me représenter le lien entre courbe de prix et chandelier.
Où pourrais-je trouver (s'il vous plait) un schéma de base "courbe/ chandelier" et aussi :quelle est l'utilité des chandeliers pour trader sur le forex?
Où pourrais-je trouver (s'il vous plait) un schéma de base "courbe/ chandelier" et aussi :quelle est l'utilité des chandeliers pour trader sur le forex?
Re: Chandeliers Japonais : peut-on s'en passer
utilité?
aucune
aucune
-
Fabien LABROUSSE

- Administrateur
- Messages : 17033
- Inscription : 17 mars 2008, 19:41
- Localisation : Paris, France
Re: Chandeliers Japonais : peut-on s'en passer
Lorenzo64 a écrit :c'est vrais qu'il y a des sites qui expliquent comment les lire mais moi je suis visuel et j'ai du mal a me représenter le lien entre courbe de prix et chandelier.
Les chandeliers Japonnais contiennent plus d'informations que les courbes, aussi, avec ce bougies on peut avoir plus d'informations et ainsi gagner du temps dans l'étude. Cela peut-être pénible à lire au départ mais on s'y fait vite.Lorenzo64 a écrit :quelle est l'utilité des chandeliers pour trader sur le forex?
Qu'est ce que tu ne comprends pas exactement?Lorenzo64 a écrit :et j'ai du mal a me représenter le lien entre courbe de prix et chandelier.
Les courbes ne permettent que de relier soit les cours de clôtures ou de fermetures, ou les plus hauts ou les plus bas. Les chandeliers Japonnais reprennent toutes ces informations en une seule représentation graphique.Lorenzo64 a écrit :Où pourrais-je trouver (s'il vous plait) un schéma de base "courbe/ chandelier"
Tu as cette fiche de formation à ce sujet: http://www.videobourse.fr/chandeliers-japonais.php
Mais tu as aussi beaucoup d'autres fiches de formation à ce sujet sur d'autres sites: https://www.google.fr/search?q=chandeli ... e&ie=UTF-8

La Structure (par VideoBourse) : Formation sur mesure et évolutive pour optimiser compréhension et résultats en trading
 Informations et inscriptions : https://forms.gle/A2vnZduSwv2wPFSS7
 Contact et échanges avec la communauté : Discord, mail, téléphone, LinkedIn...
 Marchés en aparté : Témoignages de traders, investisseurs, analystes et économistes sur les marchés financiers
Re: Chandeliers Japonais : peut-on s'en passer
je veux bien admettre que ça ait un sens sur des marchés centralisés ( actions, futures..) qui admettent une ouverture et une clôture.
mais sur le forex, marché de gré à gré 24/7 les bougies sont forcément différentes d'un broker à l'autre selon le fuseau horaire du serveur.
l'information données par les bougies dans ce cas est très sujette à caution.
mais sur le forex, marché de gré à gré 24/7 les bougies sont forcément différentes d'un broker à l'autre selon le fuseau horaire du serveur.
l'information données par les bougies dans ce cas est très sujette à caution.
Re: Chandeliers Japonais : peut-on s'en passer
Bonjour Fabien,
Merci pour tes réponses détaillées . J’ai lu ton tuto très fournit sur les chandeliers japonais : http://www.videobourse.fr/chandeliers-japonais.php. En cherchant sur d’autres sites j’ai trouvé une vidéo sympa mais en anglais sur « le lien entre courbe de prix et chandelier » http://www.investopedia.com/video/play/ ... ck-charts/ (à la 01 :01)
et aussi (en francais) une image : http://www.forexo.fr/chandeliers-japonais (courbe+ chandelier) .
Voila,avec tous ces visuels je commence à comprendre les chandeliers japonais
Bon maintenant je vais me lancer dans les Doji


Merci pour tes réponses détaillées
et aussi (en francais) une image : http://www.forexo.fr/chandeliers-japonais (courbe+ chandelier) .
Voila,avec tous ces visuels je commence à comprendre les chandeliers japonais
Bon maintenant je vais me lancer dans les Doji
-
Fabien LABROUSSE
- Administrateur
- Messages : 17033
- Inscription : 17 mars 2008, 19:41
- Localisation : Paris, France
Re: Chandeliers Japonais : peut-on s'en passer
Effectivement l'image est très claire, ça devrait aider certains débutants. Merci pour le partage.
La Structure (par VideoBourse) : Formation sur mesure et évolutive pour optimiser compréhension et résultats en trading
Informations et inscriptions : https://forms.gle/A2vnZduSwv2wPFSS7 Contact et échanges avec la communauté : Discord, mail, téléphone, LinkedIn... Marchés en aparté : Témoignages de traders, investisseurs, analystes et économistes sur les marchés financiers-
Fabien LABROUSSE
- Administrateur
- Messages : 17033
- Inscription : 17 mars 2008, 19:41
- Localisation : Paris, France
Leçon n°3 : Les chandeliers japonais
Leçon n°3 : Les chandeliers japonais
Publiée le 6 sept. 2013
Comprendre les chandeliers japonais
-- Le Doji
-- Structure d'avalement
-- Structure pénétrante
-- Les étoiles
Suivez IG sur les réseaux sociaux :
- Twitter : https://twitter.com/IG_France_
- Facebook : https://www.facebook.com/IGFrance
Copyright (c) 2013 www.igmarkets.fr
http://www.igmarkets.fr
La Structure (par VideoBourse) : Formation sur mesure et évolutive pour optimiser compréhension et résultats en trading
Informations et inscriptions : https://forms.gle/A2vnZduSwv2wPFSS7 Contact et échanges avec la communauté : Discord, mail, téléphone, LinkedIn... Marchés en aparté : Témoignages de traders, investisseurs, analystes et économistes sur les marchés financiers-
freeforex20
Chandelier Exit
Chandelier Exit
The Chandelier Exit is basically a volatility-based system that identifies outsized price movements. Le Beau defined volatility by using the Average True Range, which was developed by Welles Wilder, creator of RSI and the Average Directional Index. ATR uses the prior close, current high and current low to determine the “True Range” for a given period. After some smoothing, the daily True Range values evolve into the Average True Range for a given period of time.
By setting the Chandelier Exit for longs three ATR values BELOW the period high, the indicator provides a buffer that is three times the volatility. A decline strong enough to break this level warrants a reevaluation of long positions. The opposite applies to short positions. The Chandelier Exit for shorts is set three ATR values ABOVE the period low, which provides a volatility-based buffer. An advance strong enough to exceed this level warrants a reevaluation of short positions.
Chandelier Uptrend and forex signals
Sometimes chartists will see a strong uptrend, but not know where to jump on and when to exit. The Chandelier Exit can be used to define the trend and set a trailing stop-loss. The example below shows Eaton Corp (ETN) breaking out in early November and starting an extended uptrend. The Chandelier Exit defined this uptrend quite well as it followed price action steadily higher. This trailing stop-loss could have been used to control risk for new long positions.
With the Chandelier Exit providing the stop-loss, traders would then need to find an indicator to trigger buy signals within this trend. A sensitive momentum oscillator can be used to capture short-term oversold conditions. The indicator window shows StochRSI, which is the Stochastic Oscillator applied to RSI. Dips below .20 reflect short-term oversold conditions. A subsequent move back above .20 suggests that the uptrend is continuing.
forex signals Chandelier Downtrend
Some stocks are more volatile than others and require a bigger buffer, which means the multiplier should be increased. The Hewlett-Packard (HPQ) example shows the stock in a clear downtrend for most of 2012. A normal Chandelier Exit (22,3.0,short) would have triggered some stops just before the downtrend continued. Notice how HPQ moved above the dashed gray line several times during this downtrend. Chartists should increase the ATR multiplier for more volatile stocks, such as techs. In this example, the red Chandelier line allows for more volatility by using 5 as the multiplier. HPQ held this Chandelier setting until the breakout in mid-December, which signaled the start of an uptrend.
The Chandelier Exit is good for stops, but chartists need to use basic chart analysis or a momentum oscillator to time entries. The Commodity Channel Index (CCI) can be used to identify short-term overbought conditions within a downtrend. CCI becomes overbought with a move above +100. A subsequent move back below +100 signals that momentum is turning down again.
Conclusions
The Chandelier Exit is mostly used to set a trailing stop-loss for forex signals during a trend. Trends sometimes extend further than we anticipate and the Chandelier Exit can help traders ride the trend a little longer. Even though it is mostly used for stop-losses, the Chandelier Exit can also be used as a trend tool. A break above the Chandelier Exit (long) forex signals strength, while a break below the Chandelier Exit (short) forex signals weakness. Once a new trend begins, chartists can then use the corresponding Chandelier Exit to help define this trend.
free forex signals presents special offer
open trading account with one of the best forex brokers and GET FREE forex Signals via SMS, Email and WhatsApp
SIGN UP FOR A FREE TRIAL To Access FREE Forex Signals in the Members Area START FREE 30 DAYS TRIAL on https://www.freeforex-signals.com/
-
Fabien LABROUSSE
- Administrateur
- Messages : 17033
- Inscription : 17 mars 2008, 19:41
- Localisation : Paris, France
Les configurations en Chandeliers Japonais essentielles pour Gagner en Bourse
Ce soir à 19h :
Les configurations en Chandeliers Japonais essentielles pour Gagner en Bourse
En tant qu’investisseur, réussir à lire le comportement des opérateurs est une obligation.
Savoir qui, des vendeurs, ou des acheteurs, maîtrisent et tiennent le marché est essentiel.
Savoir repérer les faiblesses des uns, les forces des autres, mais aussi les moments de retournements est fondamental.
 Qu’aurez-vous appris après avoir suivi ce webinaire ?
Vous saurez maîtriser les bases des configurations en chandeliers
Vous saurez tirer profit des retournements
À qui s’adresse ce webinaire ?
Ce webinaire est accessible à toutes et tous, investisseurs débutants et traders expérimentés souhaitant en apprendre davantage sur l’analyse technique
 Orateur : Bernard PRATS-DESCLAUX, Trader, Auteur, Gérant de E-Winvest
Biographie : Bernard PRATS-DESCLAUX, est à la fois Trader, Auteur et Entrepreneur. Spécialiste des stratégies de marchés et expert des contrats Futures il intervient régulièrement lors de conférences et de séminaires sur sur la bourse et le trading. Il est l’auteur des ouvrages à succès « Trading et contrats Futures » et « Stratégies de marchés : Futures, CFD, Actions » aux éditions Eyrolles. Depuis 2014, il rend la bourse et les marchés financiers accessibles à tous via le projet E-Winvest. Celui-ci combine formation, accompagnement et outils d’aide à la décision.
Site : http://www.bpdtrading.com/
Bernard et moi-même sommes membres de l'AFATE (Association Française des Analystes Techniques - https://afate.com/)
>> Informations et inscriptions
Les configurations en Chandeliers Japonais essentielles pour Gagner en Bourse
Savoir qui, des vendeurs, ou des acheteurs, maîtrisent et tiennent le marché est essentiel.
Savoir repérer les faiblesses des uns, les forces des autres, mais aussi les moments de retournements est fondamental.
 Qu’aurez-vous appris après avoir suivi ce webinaire ?
Vous saurez maîtriser les bases des configurations en chandeliers
Vous saurez tirer profit des retournements
À qui s’adresse ce webinaire ?Ce webinaire est accessible à toutes et tous, investisseurs débutants et traders expérimentés souhaitant en apprendre davantage sur l’analyse technique
 Orateur : Bernard PRATS-DESCLAUX, Trader, Auteur, Gérant de E-Winvest
Biographie : Bernard PRATS-DESCLAUX, est à la fois Trader, Auteur et Entrepreneur. Spécialiste des stratégies de marchés et expert des contrats Futures il intervient régulièrement lors de conférences et de séminaires sur sur la bourse et le trading. Il est l’auteur des ouvrages à succès « Trading et contrats Futures » et « Stratégies de marchés : Futures, CFD, Actions » aux éditions Eyrolles. Depuis 2014, il rend la bourse et les marchés financiers accessibles à tous via le projet E-Winvest. Celui-ci combine formation, accompagnement et outils d’aide à la décision.
Site : http://www.bpdtrading.com/
Bernard et moi-même sommes membres de l'AFATE (Association Française des Analystes Techniques - https://afate.com/)
>> Informations et inscriptions
La Structure (par VideoBourse) : Formation sur mesure et évolutive pour optimiser compréhension et résultats en trading
Informations et inscriptions : https://forms.gle/A2vnZduSwv2wPFSS7 Contact et échanges avec la communauté : Discord, mail, téléphone, LinkedIn... Marchés en aparté : Témoignages de traders, investisseurs, analystes et économistes sur les marchés financiers