Re: Les Suisses peuvent-ils changer le destin de l'or ?
Publié : 29 déc. 2014, 18:03
par ulysse
Une question cependant.
Qu'est ce qui peut faire penser qu'il est intéressant d'acheter de l'or sur les niveaux actuel?
Pourquoi pas un retour à 750$?
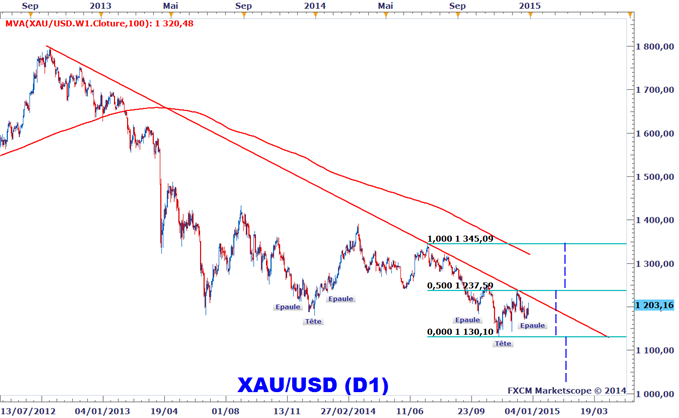
Métaux précieux : Perspectives pour l’once d’or en 2015
Publié : 31 déc. 2014, 10:22
par DailyFX
L'once d'or a terminé l'année 2014 quasiment inchangée même si les douze derniers mois ont été plus négatifs que positifs pour le métal jaune. Etablir des prévisions sur l'or l'année dernière était beaucoup plus difficile qu'en 2012 et en 2013 étant donné les mouvements erratiques du marché. Avec un point haut fait à 1.392$ en mars et un point bas à 1.130$ en novembre, il faut noter que l'or a su mieux résisté face à l'appréciation rapide du dollar US que la majorité des devises sur le marché des changes ainsi que d'autres matières premières. Cela a permis au XAUUSD de terminer l'année proche de son prix d'ouverture (1.206$), malgré une bonne partie de l'année en négatif, étant donné la force du Dollar américain.
En 2015, il est difficile de prévoir un meilleur avenir pour le métal jaune car la Réserve fédérale (Fed) s'apprête à remonter ses taux d'intérêt, ce qui devrait favoriser une appréciation continue du dollar US. A la fin de 2014, ce consensus est bien ancré, et la majorité des économistes s'attend à ce que la banque centrale américaine annonce un premier relèvement de son taux directeur de 25 points de base durant le troisième trimestre de 2015.
Nous rappelons que la tendance de l'or est expliquée par plusieurs facteurs fondamentaux sur le moyen / long terme, mais l'évolution du dollar américain reste le plus important. Ces facteurs sont les suivants :
•Anticipations d'inflation : l'or est traditionnellement acheté comme valeur de protection contre une perte du pouvoir d'achat. Les investisseurs achètent généralement le métal lorsqu'ils anticipent une accélération de l'inflation.
•Tendance du dollar américain : puisque coté en USD comme toutes les matières premières, l'or a tendance à perdre sa valeur lorsque le billet vert se renforce.
•Sentiment pour le risque : la pensée populaire veut que l'or soit une valeur refuge lors de périodes de turbulence sur les marchés financiers. Il est vrai que nous avons observé des périodes de tensions où le métal est recherché (comme avec le début de la crise ukrainienne en février 2014), mais ce sont souvent des effets passagers. Il ne faut pas penser que l'or doit être acheté pour se protéger contre les risques sur les marchés, mais les périodes d'inquiétude permettent des fois d'arbitrer entre le métal jaune et les indices boursiers.
Perspectives pour l'once d'or (XAUUSD) en 2015
Le consensus acheteur du dollar américain et les prévisions d'une normalisation de la politique monétaire de la Fed limitent le potentiel d'appréciation de l'or même si d'autres banques centrales en Asie et en Europe maintiendront des politiques accommodantes avec encore de la marge pour de nouvelles mesures d'assouplissement en 2015.
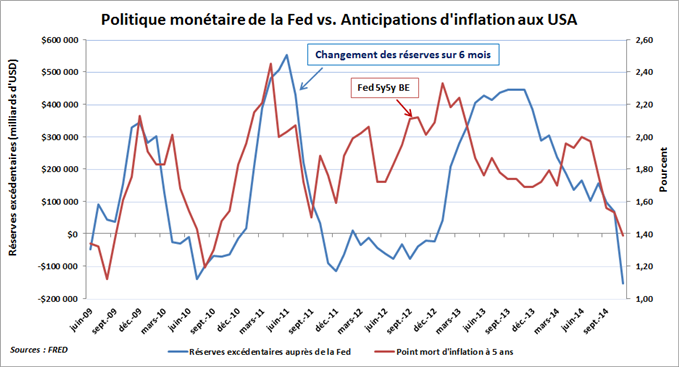
Mais le resserrement probable de la politique monétaire de la Fed risque de pénaliser le métal jaune car un relèvement des taux d'intérêt aux Etats-Unis renforcera probablement l'attrait du billet vert. A la fin de 2014, la majorité des économistes s'attend à ce que la banque centrale annonce une hausse de son taux directeur de 25 points de base durant le troisième trimestre. Pour préparer le terrain à un nouveau cycle des taux, la Fed procède à des opérations supplémentaires comme les reverse repos et la Term Deposit Facility (TDF) depuis un moment afin de drainer la liquidité excédentaire du système bancaire. Ces opérations ont pour résultat une baisse des réserves excédentaires, qui figurent dans le passif de la Fed, et donc une diminution de la masse monétaire aux Etats-Unis.
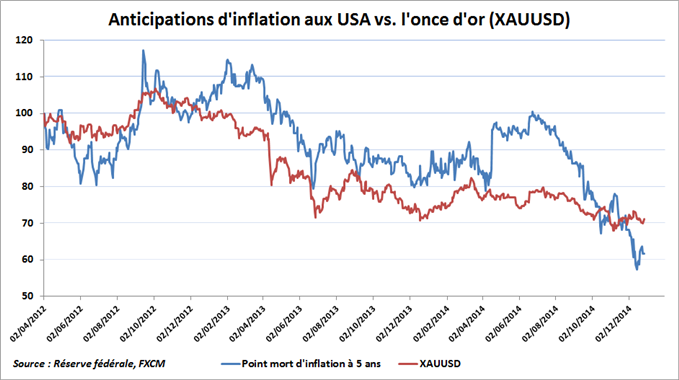
Face à ce resserrement monétaire aux Etats-Unis, les anticipations d'inflation ont considérablement baissé durant la deuxième moitié de 2014. En effet, le point mort d'inflation à 5 ans est passé d'environ 2,00 % en juillet à 1,20 % en décembre, soit son plus bas niveau depuis 2010. Le drainage de la liquidité du système bancaire était également une des raisons pour laquelle le dollar US s'est apprécié autant durant le deuxième semestre de 2014 (divergence des politiques monétaires). Quoi qu'il en soit, la normalisation graduelle de la politique monétaire de la Fed a pesé sur le cours de l'or en 2014 et pénalisera probablement ce marché en 2015.
Graphique 1 : Les réserves excédentaires à la Fed et le point mort d'inflation à 5 ans
Graphique 2 : Point mort d'inflation à 5 ans et l'once d'or (XAUUSD)
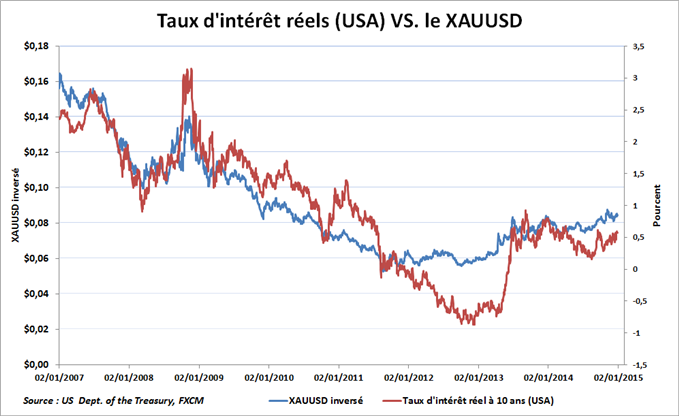
Un relèvement des taux de la Fed devrait logiquement donner suite à une hausse similaire des taux obligataires. De nombreux analystes et économistes se sont pourtant trompés lorsqu'ils ont prévu une progression des taux en 2014, mais cela ne les empêche pas d'anticiper la même chose pour 2015. Couplée avec une accélération de la croissance économique aux Etats-Unis, une hausse des taux obligataires serait légitime avec le resserrement monétaire de la Fed. Cependant, il faut tout de même être prudent concernant de telles prévisions compte tenu des anticipations basses en matière d'inflation.
Graphique 3 : Les taux d'intérêt réels aux USA et l'once d'or
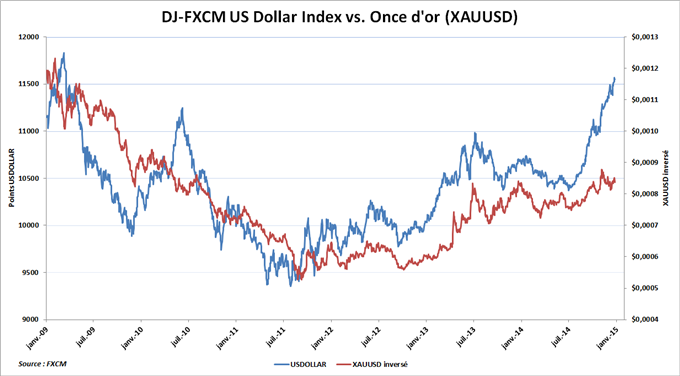
Hausse des taux obligataires ou pas, l'once d'or devrait être pénalisée par l'appréciation du dollar américain comme la corrélation inverse entre le métal jaune et le billet vert reste forte. Anticiper correctement l'évolution du dollar aide à mieux prévoir la tendance du XAUUSD, et la monnaie américaine semble destinée à se renforcer davantage compte tenu des politiques accommodantes des banques centrales en Europe et en Asie. Ceci dit, nous ne serions pas surpris de voir le billet vert amorcer une période de consolidation au début de 2015, ce qui aiderait l'or à gagner du terrain au premier trimestre comme il l'a fait au T1 2014.
Graphique 4 : Le Dow Jones-FXCM US Dollar Index et l'once d'or
Analyse technique de l'once d'or (XAUUSD)
Sur le plan technique, le XAUUSD a terminé l'année 2014 avec un chandelier annuel en forme de doji. Le marché est coincé entre deux lignes de tendance avec un support à 1.130$ et une résistance à 1.238$. Une sortie de cette zone annoncerait probablement une dynamique des prix qui permettrait aux traders de mettre en place des stratégies de suivi de tendance.
Pour commencer l'année, nous allons nous intéresser à une figure en Epaule-Tête-Epaule inversée (ETEI) qui a pris forme entre septembre et décembre. La validation de cette configuration de retournement avec un dépassement de la ligne de tendance baissière pourrait permettre d'anticiper un retour vers les 1.300$. Surveillez donc une cassure de la zone des 1.220/38$ pour trader selon ce scénario. Inversement, si l'or n'arrive pas à franchir sa ligne de tendance et se remet à baisser en dessous des 1.220$, une opportunité de vente se présentera probablement avec une invalidation de l'hypothèse de l'ETEI par la suite. Dans ce cas, nous anticiperons une reprise de la tendance baissière de fond avec une possible accélération en cas de cassure des 1.130$.
Par Adrian Raymond, Analyste de Marché pour DailyFX.fr
Pour me contacter, écrivez à araymond@fxcm.fr
Suivez-moi sur Twitter : @AdrianRaymondFX
Bonjour,
Je vous propose en vidéo mes scénarii de moyen terme pour l'or.
Je présente sous un format pédagogique mon processus d'analyse, mes projections et seuils d'invalidation.
Webinaire: Edoardo CIAMPELLETTI, Analyste chez Orbex: Analys
Publié : 27 déc. 2016, 15:19
par Fabien LABROUSSE
Il y a quelques semaines, Edoardo CIAMPELLETTI, Analyste chez le broker Orbex, nous livrait son analyse moyen long terme sur l'or, avec une vision précise pour 2017:
Tendance baissière sur l'or mais les supports tiennent pour l'instant.
Ajoutée le 25 déc. 2016
CMC Markets est un acteur global de l'industrie des CFD. Apprenez comment trader CFD sur Actions, Indices, Devises, Matières Premières et Taux.
Les informations présentées dans cette vidéo ont un caractère purement informatif et ne constituent ni un conseil en investissement, ni une recommandation d'achat ou de vente d'instruments financiers, de produits ou de services. CMC Markets ne saurait être tenu responsable de toute perte subie ou de toute décision prise ou non sur la base des informations contenue dans cette vidéo. Les CFD sont des produits spéculatifs présentant un risque de perte supérieure au capital investi. Ils sont destinés à des investisseurs avertis en matière financière pouvant surveiller leurs positions de façon continue et ayant les moyens financiers de supporter un risque de perte en capital. Les CFD sont liés à des actifs sous-jacents extrêmement variés. Les CFD présentent des risques spécifiques qui peuvent varier grandement d'un produit à l'autre, par exemple s'agissant de la rapidité des variations des cours ou en matière de liquidité.
l'or vaut de l'or ...
Publié : 26 avr. 2017, 16:12
par vbcasimir
bonjour,
je propose l'or sur du long terme ...
entrée pour les "moins pressés" : 1297.34
stop loss : 1176.81
pour les plus agressifs, les plus audacieux une entrée plus tôt ... j'ouvrirais prochainement un autre post à part.
Graphique Daily
Graphique H4
A suivre ...
Re: Or / Gold: Analyses Techniques et Fondamentales
Publié : 26 avr. 2017, 17:02
par royaltea
Fait tu partie de ceux qui pensent que l' or as touché son minimum de cout de revient a 1150 et est désormais partie pour une longue remonté de plusieurs mois voire plusieurs années ?
Or / Gold: Analyses Techniques et Fondamentales
Publié : 27 avr. 2017, 09:29
par vbcasimir
bonjour,
Je ne sais si je fais parti d'un groupe de pensée à son sujet, disons que je me base sur mes analyses d'une, puis sur le faite que l'or reste un instrument de repli face au situation d'incertitude ...
Puis l'or n'est-il pas l'ami de l'homme depuis un certain temps
Salon de l'AT 2017 - Débat des Matières Premières Or et Pétr
Publié : 27 avr. 2017, 15:27
par Fabien LABROUSSE
Salon de l'AT 2017 - Débat des Matières Premières Or et Pétrole: CUSSAC / TRICHET
"Venez assister à la confrontation de nos 2 experts, sur l'analyse et les stratégies de trading qu'ils conseillent pour les prochains mois sur les deux Commodities les plus regardées et étudiées à travers le monde : l'Or et le Pétrole (Or Noir). L'évolution de l'une et l'autre de ces marchandises est primordial, comme elles sont causes de répercussions importantes sur l'ensemble des marchés et économies de la planète. Il est donc plus que judicieux de tenir compte de leurs évolutions à court, moyen et long terme. Bien que les événements géopolitiques récents aient directement impactés leurs comportements, il est capitale d'y voir plus clair maintenant, en étudiant leur graphique respectif, afin de se positionner de manière appropriée, en évitant toute erreur ou décision maladroite."
Or/ Gold: Analyses Techniques et Fondamentales
Publié : 30 avr. 2017, 13:33
par vbcasimir
bonjour,
l'or se rapproche du niveau 1270.40 déjà touché deux fois ...
je préparais donc un ordre différé niveau 1271.95 et un stop loss serré niveau des 1259.02
Après il faut voir comment ouvrira le cours de l'or des mardi peut-être l'aura t-il franchi ou bien repartira vers le support actuel ...
Analyse technique et fondamentale de l'évolution des cours de l'or / gold à court, moyen et long terme, en ce 26 juin 2017, jour de pression baissière significative pour le métal précieux. Nous étudierons également les avis de différents experts.
daily gold technical analysis free
Publié : 07 nov. 2017, 21:37
par Athar dewidar
daily gold technical analysis free
Free Gold Daily Technical Outlook and Analysis provides technical analysis report
During last week's trading, the gold formed a correction pattern
Ascending from the 1264 level and ending at 1283
The price of gold on the global exchange fell after this correction,
and in this case
Gold is expected to continue falling to 1242
Which represents the price target for a possible measured move pattern
where gold has fallen from
From 1305 to 1264, representing the first wave of the AB = CD
As indicated by the daily Gold Technical Analysis and Gold Outlook from Gold Pattern
Gold is preferred on the international exchange to sell
as long as the price of gold is trading below 1285
And if the horizontal resistance level breached 1285 and
the price is stable above this level
The bearish trend for gold in the near term is reflected and gold starts to rise
For all traders, Gold Pattern free service can be obtained
Gold Recommendations and Instant Daily Currencies sent on mobile and e-mail
gold signal and XAU USD technical analysis
Publié : 09 nov. 2017, 15:12
par Athar dewidar
gold signal and XAU USD technical analysis
Published: Wednesday, 08 November 2017 19:02
Free gold daily technical analysis , gold price forecasts and outlook
via gold pattern Mobile text messages and e-mail
Technical Gold Technical Analysis Today, the bullish Measured moved AB = CD has appeared on
The chart of the price of gold since last trading last month and so far
The pattern began to rise from the 1264 level until the price of
gold reached 1284 and formed accordingly The first wave
The last wave or second man formed from the level of
1265 until the price reached the current level of 1286
The correlation between the first wave and the last wave can be
observed, which represents a sell-off
Gold near the 1286 level is approaching an important high
The gold or gold analysis and the analysis of the price models
indicate the chances of gold continuing to decline
For this reason, Gold Batrn offers a recommendation to sell gold immediately, free and direct
gold
sell @ 1286
tp1 @ 1272
tp2 @ 1262
sl @ 1293
Category: Gold Signals
Re: daily gold technical analysis free
Publié : 16 nov. 2017, 00:18
par wissan
good info
Re: gold signal and XAU USD technical analysis
Publié : 16 nov. 2017, 12:36
par jennifertaylor0009
If the gold trading marketing experts were so experts, they would be buying stock, not selling advice. Best traders are not afraid of holding on to gold trading stocks, they are afraid of holding on to losing stocks.
Gold price recommendations , trading signals and forecasts
Publié : 16 nov. 2017, 17:25
par Athar dewidar
Gold price recommendations , trading signals and forecasts
Published: Wednesday, 15 November 2017 18:25
Gold price recommendations , trading signals and forecasts in the global market
according to Daily gold xau usd Technical Analysis from Gold Pattern
From the middle of last month gold prices are trading in a pattern
similar to the rounding bottom pattern
And the price of gold rose from the level of 1264, which is
the first bottom in the pattern of the three rising bottoms upward
Gold formed the second bottom near the 1265 level at
the beginning of this month and the third and last bottom were near
Level of 1270, which appeared yesterday on the gold chart
If prices are stable above the 1290 level, the technical gold outlook
is likely to be bullish move to the next rising strength will jump
the price of gold near the levels of 1310 and more
Looking at the gold prices on the hour chart
we find that the high price of an ounce of gold
From 1270 to 1290 represents the first wave of the ABCD pattern
Gold Technical Daily Summary and Gold Outlook
Prefer to buy gold on the World Gold Exchange
This is why Gold pattern is offering a free instant live buy
gold trading signals recommendation
gold
buy @ 1276
tp1 @ 1290
tp2 @ 1300
sl @ 1269
Category: Gold Signals
gold technical analysis and AB= CD Pattern
Publié : 18 nov. 2017, 15:24
par Athar dewidar
gold technical analysis and AB= CD Pattern
Published: Friday, 17 November 2017 19:22
Gold Daily trading signals and Gold Technical Analysis from Gold Pattern
Gold reached a new high on Friday and reached the price target we mentioned
in the previous XAU USD gold technical analysis
Gold formed the measured move pattern AB = CD and the pattern started
from the support level 1264 until
Level of 1288 to form the first leg or the first wave of the rising pattern
Then the price of gold rose again from the level of 1270 to the level of 1306
to be the second wave Or the bullish second leg of the pattern
By analyzing gold technically we find that the price of gold now near
the resistance level 1304 in the medium term
And with the emergence of the Japanese reversal candle pattern
known as the shooting star
Which is a strong entry point to sell o gold on the global market
Free daily gold trading strategy
Gold is preferred to be sold on the Gold Exchange
All gold pattern 's trading signals are live market order
are immediately applied to the market price
gold
sell @ 1296
tp1 @ 1282
tp2 @ 1272
sl @ 1303
Category: Gold Signals
gold technical analysis and trading signals
Publié : 24 nov. 2017, 15:38
par Athar dewidar
gold technical analysis and trading signals
Published: Wednesday, 22 November 2017 19:24
Gold prices fell rapidly and sharply with the start of trading this week,
which is considered the first wave or the first Leg
For a bearish trend or a bearish correction. Gold rose today
consider a corrective wave for the expected decline in gold prices
The technical gold analysis today indicates the possibility of a second bearish wave
Similar to the first wave that emerged with the start of trading this week
In this case, the price target for gold according to AB = CD pattern is near 1272
As the levels of 1292-1297 represent an important resistance area for gold prices
Looking at gold prices over the medium term from the beginning of last October,
we find that the sideways trend controls gold trading
And that the price of gold near the level of 1292 is near the resistance levels
of sideway trend
Gold trading strategy today, trading aignals ,
gold price forecast and technical analysis summary
Gold is preferred to sell on the Gold Exchange
gold
sell @ 1292
tp1 @ 1278
tp2 @ 1268
sl @ 1299
gold technical analysis and trading signals
Publié : 24 nov. 2017, 20:17
par Athar dewidar
gold technical analysis and trading signals
Published: Wednesday, 22 November 2017 19:24
Gold prices fell rapidly and sharply with the start of trading this week,
which is considered the first wave or the first Leg
For a bearish trend or a bearish correction. Gold rose today
consider a corrective wave for the expected decline in gold prices
The technical gold analysis today indicates the possibility of a second bearish wave
Similar to the first wave that emerged with the start of trading this week
In this case, the price target for gold according to AB = CD pattern is near 1272
As the levels of 1292-1297 represent an important resistance area for gold prices
Looking at gold prices over the medium term from the beginning of last October,
we find that the sideways trend controls gold trading
And that the price of gold near the level of 1292 is near the resistance levels
of sideway trend
Gold trading strategy today, trading aignals ,
gold price forecast and technical analysis summary
Gold is preferred to sell on the Gold Exchange
gold
sell @ 1292
tp1 @ 1278
tp2 @ 1268
sl @ 1299
gold analysis and XAU USD trading signals free daily live
Publié : 06 déc. 2017, 16:28
par Athar dewidar
gold analysis and XAU USD trading signals free daily live
Published: Monday, 04 December 2017 16:52
Gold technical analysis, price forecasts and gold trading signals from Gold Pattern
The gold trade witnessed a sharp and rapid decline with the end of trading last week
The price of gold has reached a level of 1270
Which was re-tested again at the beginning of this week
Gold price bear movements and trends can be analyzed as a corrective wave
for the past up trend
Which was made by gold rose from the level of 1264 until it reached the level of 1297
The price pattern can be analyzed on the current as a flat or occasional correction
And that the price of gold over the area 1270-1264 is above
an important support area in the near and medium term
A summary of the daily technical gold analysis, taking into account
the sideway -direction that controls gold trading over the medium term
Gold Trading Strategy and Gold Price Analysis and Forecasts from Gold Pattern
Gold is preferred to buy as long as the price of gold is above 1264
That is why Gold Parttern offers a free live buy gold trading signal free
Gold Technical Analysis for long term and trading signals fr
Publié : 10 déc. 2017, 16:31
par Athar dewidar
Gold Technical Analysis for long term and trading signals free
Published: Saturday, 09 December 2017 19:26
Gold Technical Analysis On the daily Farm, from one year from now,
gold has formed a bullish uptrend which started from The 1120 level
and the gold price broke the long term uptrendline near the 1260 level
which is an early signal of the reversal of the long term bullish trend
A technical analysis of the medium term indicates the emergence of the measured move pattern
AB = CD And the first wave of the pattern strarted from the level of 1357
until it reached the level of 1260
And the second wave rebounds from around 1300 level and is expected to close near the 1210 level
Technical gold price forecasts suggest that gold prices may continue to fall
To near the 1210 level which represents a significant support level over the medium term
Gold trading strategy and gold price outlook over the medium term
Prefer to sell gold in the medium term as long as the price of gold below the level of 1260
Targeting the 1210 level of profit-taking
gold technical analysis and xau usd trading signals sell
Publié : 15 déc. 2017, 18:37
par Athar dewidar
gold technical analysis and xau usd trading signals sell
Published: Wednesday, 13 December 2017 17:47
The price of the ounce of gold fell at the beginning of this week,
confirming the breach of the gold price of the rising trend line
Which we mentioned in the previous gold technical analysis and forecasts of
gold analysis today indicate the chances of continued decline of gold
Where the symmetrical triangle pattern on the gold chart has appeared on
the daily Frame and on the four hour frame Which is a corrective wave in the bearish trend
from the level of 1356 and is expected to reach the second wave of this decline near the level of 1210
On the hourly frame we find that the price of gold rose today and formed the pattern of
the zigzag correction, which ends near the previous resistance level 1248
Which represents an opportunity to sell gold
Gold Trading Strategy Today, Gold Technical Analysis Summary and Gold trading Recommendation
It is preferable to sell gold on the international market as long as gold is under the influence of the bearish trend and did not exceed 1255
Gold Technical Analysis from Gold Pattern
Publié : 25 déc. 2017, 15:00
par Athar dewidar
Gold Technical Analysis from Gold Pattern
Published: Saturday, 23 December 2017 18:48
Gold Technical Analysis from Gold Pattern
Although the trading and technical analysis of gold and currencies during the month of December is
marked by many fluctuations because of the end of the year
There is a group of technical gold indicators that should be mentioned today in the technical gold analysis
The most important of these is that the price of gold formed the correction zigzag pattern or measured move price pattern during the rise from the level of 1236
Second gold technical indicator , the rise in gold over the past two weeks represents
a correction of 62% of Fibonacci ratios
Thirdly gold indicator , the price of gold approaches the bearish trend line over the medium term and
if the bearish trend line plays the role of resistance that will push gold price down
The daily gold technical outlook suggests that gold may resume the medium term bearish trend
Re: Or / Gold: Analyses Techniques et Fondamentales
Publié : 14 janv. 2018, 08:34
par oswaldo717
Forecasts
The price of gold leads to a fifth weekly profit
Gold prices ended the session on Thursday up $ 5.44 per ounce, extending gains from the previous trading session as the dollar fell after the December European Central Bank meeting minutes showed that the central bank could cut your massive monetary stimulus program sooner than expected. XAU / USD is currently trading at $ 1291.52, above the opening price of $ 1294.40, but upside potential may be limited as investors expect the Consumer Price Index for December and retail sales for December. USA
Short-term charts suggest that bulls have the medium-term technical advantage. The XAU / USD was able to stay above the clouds of Ichimoku on chart H1, while the bulls defended their camp in 1316. On the upside, the 1335-1332.20 area stands out as the initial barrier. Successfully breaking this key resistance would attract new purchases. In this case, the market will point to 1340 dollars.
free gold trading signals today after break down uptrend lin
Publié : 23 janv. 2018, 23:18
par Athar dewidar
free gold trading signals today after break down uptrend line
Published: Friday, 19 January 2018 12:39
Gold Trading signals free live Today from Gold Patternthat send directly on mobile and email every day
Gold Sale recommendation from Gold Pattern the Best gold signals provider and website Recommendations
gold
sell @ 1336
tp1 @ 1322
tp2 @ 1312
sl @ 1343
Gold Technical Analysis Today and Gold Price Forecasts and the reason for the recommendation to sell gold today:
Gold broke through the medium term bullish trend line near the 1330 level
The gold price has been rised to re-test the trend line after breakout ,
which reversed the role and became the resistance level now
Which is the signal for the sale of gold in the global market
Gold Technical Analysis Today Gold is preferred to sell XAU USD as long as the price of gold is below 1343
Re: Or / Gold: Analyses Techniques et Fondamentales