Analyses de Marchés

Venez découvrir ou nous faire partager des Analyses Techniques ou Fondamentales concernants les indices, des valeurs spécifiques, les Devises...

Modérateur : Administrateurs

Message
Auteur
HFblogNews
VideoBourse family
Messages : 2557
Inscription : 26 juin 2014, 12:48

Re: Analyses de Marchés

#901 Message par HFblogNews »

Date: 15th September 2026.

NASDAQ Rebound Ends as US Bond Yields Break Above 5%.

Image
Trading Leveraged products is Risky

Technology stocks attempt a rebound after declining to a five-week low. However, fundamentals continue to weigh on demand as yields and oil prices rise. The US 10-year bond yield has now reached the highest level since 2007 and risen above the critical 5% mark. Oil prices also continue to remain above $100 and have reached a high of $103.45.

In addition to volatility among technology stocks, the US Dollar also moves higher and is the best-performing currency. The worst-performing currencies are the Japanese Yen and New Zealand Dollar. Market indications continue to point towards investors pricing in more frequent rate hikes, lower consumer sentiment, and higher credit risk. A key indication that investors are paying close attention to is bond yields rising to levels that indirectly contributed to the 2007-2008 financial crisis.

NASDAQ Rebound Fails as Investors Await AI Clarity

The NASDAQ has fallen 0.30% this morning and 1% from the most recent high. Investors on Monday did take advantage of the lower purchase price, which boosted demand as a result. However, many elements continue to point towards the possibility of stock market weakness.

A key development is in the AI sector which continues to see AI companies and the White House clash. Lawmakers are developing legislation to address AI safety concerns. This includes a bipartisan group of senators working on measures that would require leading AI developers to take steps to prevent catastrophic risks.

White House advisor David Sacks advises that AI-companies are looking for the government to loosen legislation related to antitrust and reliability. According to experts, this is not likely to change, and for this reason, AI-companies will look to slow production to closely monitor risks. Traders should keep in mind that AI development has been one of the key drivers of the market’s bullish trend over the past three years. A key risk for investors is the possibility that this momentum weakens, removing an important source of support for the broader market.

In addition to this, tomorrow’s Federal Reserve interest rate decision and the Chair’s tone are likely to create considerable volatility. Currently, investors are pricing in up to two interest rate hikes in 2026. If the Fed hikes tomorrow evening and takes a hawkish tone, demand for stocks could fall.

Image
HFM - NASDAQ 12-Minute Chart

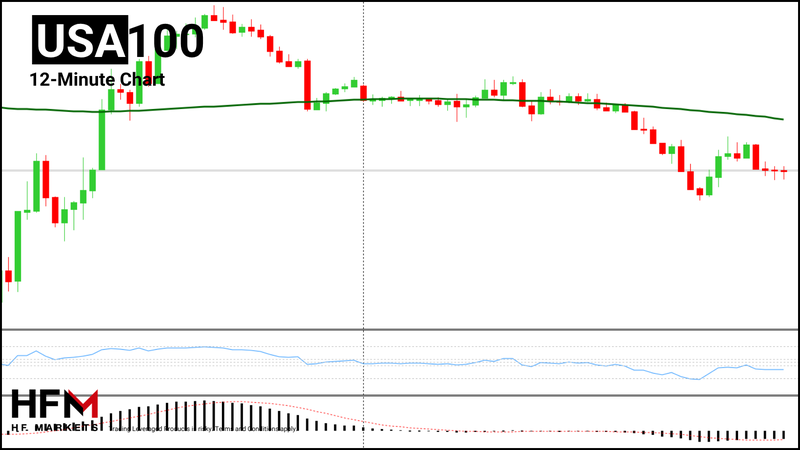
Currently, the price remains below key moving averages and below the VWAP. Order flow is also indicating weakness in demand. If the price falls below $29,004.38, sell signals from technical analysis are likely to strengthen. If the price rises above $29,215.65, sell signals in the short term will be completely erased.

GBP/USD - US Dollar Rises While UK Employment Weakness Pressures the Pound

The British Pound is coming under pressure from the most recent employment data. The UK’s monthly benefit claims have risen by almost 28,000, significantly higher than previous expectations. The figure is also a three-month high and is considerably weaker compared to the latest US NFP data. In addition to this, the market continues to expect the Bank of England to keep interest rates unchanged on Thursday, unlike the Federal Reserve and European Central Bank.

The US Dollar Index rose 0.20% during this morning’s Asian session and is also close to forming a bullish breakout. Supporting the US Dollar is the increase in bond yields and rate-hike expectations. The fact that US 10-year bond yields have risen above 5% could trigger lower risk appetite. This could also support the US Dollar due to its safe haven-status.

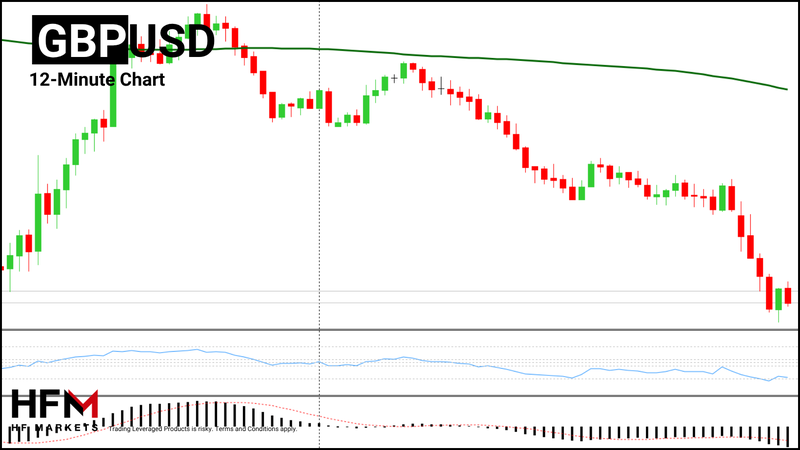
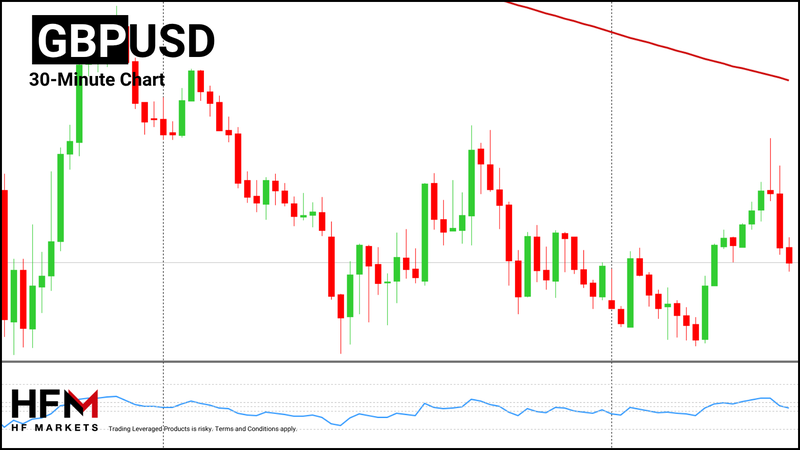
The price of the GBP/USD is forming clear bearish swings and lower highs. Technical indicators also point towards a bearish bias, but investors will be cautious of the support level at 1.34630. Bearish sentiment is likely to remain while the GBP/USD remains below the 200-bar moving average at 1.34915.

Image
HFM - GBPUSD 12-Minute Chart

Key Takeaways:

* Technology stocks remain under pressure despite attempts to rebound from recent five-week lows.
* US 10-year bond yields above 5% are increasing concerns around borrowing costs and financial conditions.
* Oil prices above $100 are reinforcing inflation concerns and adding pressure on broader market sentiment.
* The US Dollar is strengthening as investors price in further rate hikes and rising risk aversion.

Always trade with strict risk management. Your capital is the single most important aspect of your trading business.

Please note that times displayed based on local time zone and are from time of writing this report.

Click HERE to access the full HFM Economic calendar.

Want to learn to trade and analyse the markets? Join our webinars and get analysis and trading ideas combined with better understanding of how markets work. Click HERE to register for FREE!

Click HERE to READ more Market news.

Michalis Efthymiou
HFMarkets


Disclaimer: This material is provided as a general marketing communication for information purposes only and does not constitute an independent investment research. Nothing in this communication contains, or should be considered as containing, an investment advice or an investment recommendation or a solicitation for the purpose of buying or selling of any financial instrument. All information provided is gathered from reputable sources and any information containing an indication of past performance is not a guarantee or reliable indicator of future performance. Users acknowledge that any investment in Leveraged Products is characterized by a certain degree of uncertainty and that any investment of this nature involves a high level of risk for which the users are solely responsible and liable. We assume no liability for any loss arising from any investment made based on the information provided in this communication. This communication must not be reproduced or further distributed without our prior written permission.
HotForex is an award winning, fully regulated and licensed online forex and commodities broker. Offers various accounts, trading software and trading tools to trade Forex and Commodities for individuals, fund managers and institutional customers.

HFblogNews
VideoBourse family
Messages : 2557
Inscription : 26 juin 2014, 12:48

Re: Analyses de Marchés

#902 Message par HFblogNews »

Date: 16th September 2026.

Fed Rate Decision in Focus: GBP/USD, S&P 500, and Gold Outlook.

Image
Trading Leveraged products is Risky

All eyes are on the Federal Reserve’s rate decision, while the Middle East and the AI slowdown take a back seat. Market participants are pricing in a rate hike of 0.25% which would be positive for the US Dollar but more or less negative for all other assets. However, a key element will be the Federal Reserve’s tone during the press conference.

The US Dollar Index rose to a two-week high this morning but has since lost momentum. Oil prices also continue to rise, putting further pressure for the Federal Reserve to continue hiking in the coming months. Lastly, Gold and equities continue to remain weak, but are not currently declining.

GBP/USD - Markets Price In Fed Rate Hike

Of particular interest to traders who are looking to trade the Dollar long is the GBP/USD. The GBP is coming under pressure from the latest weak employment data and expectations of a Bank of England pause. The Bank of England will announce its rate decision on Thursday and is likely to be the only central bank among the ‘top four’ currencies not to hike this month. The European Central Bank adjusted rates by 0.25% last week, and markets expect the Fed and Bank of Japan to do the same this week.

The Pound is not the worst-performing currency of the week nor the month, however, it is the worst-performing currency of the past 24 hours. If the Fed and the BoJ both hike and sound relatively hawkish, the GBP may become unattractive in the medium term.

Currently, the bond market is indicating a hawkish Federal Reserve, however, the Fed Chair is not likely to give concrete guidance. Nonetheless, his tone on inflation could become extremely influential. If the Federal Reserve seems willing to hike consecutively, the US Dollar could again find support and again rise above 100.000.

Image
HFM - GBP/USD 30-Minute Chart

The GBP/USD on a 1-hour timeframe is forming a descending triangle pattern, which indicates low demand for the pound. In addition to this, the GBP/USD is trading below the key moving averages on most timeframes. In the past hour, the bearish momentum has continued to gain speed as UK inflation failed to rise above expectations. As a result, a pause from the Bank of England now appears more likely.

S&P 500 - Sellers Remain Active

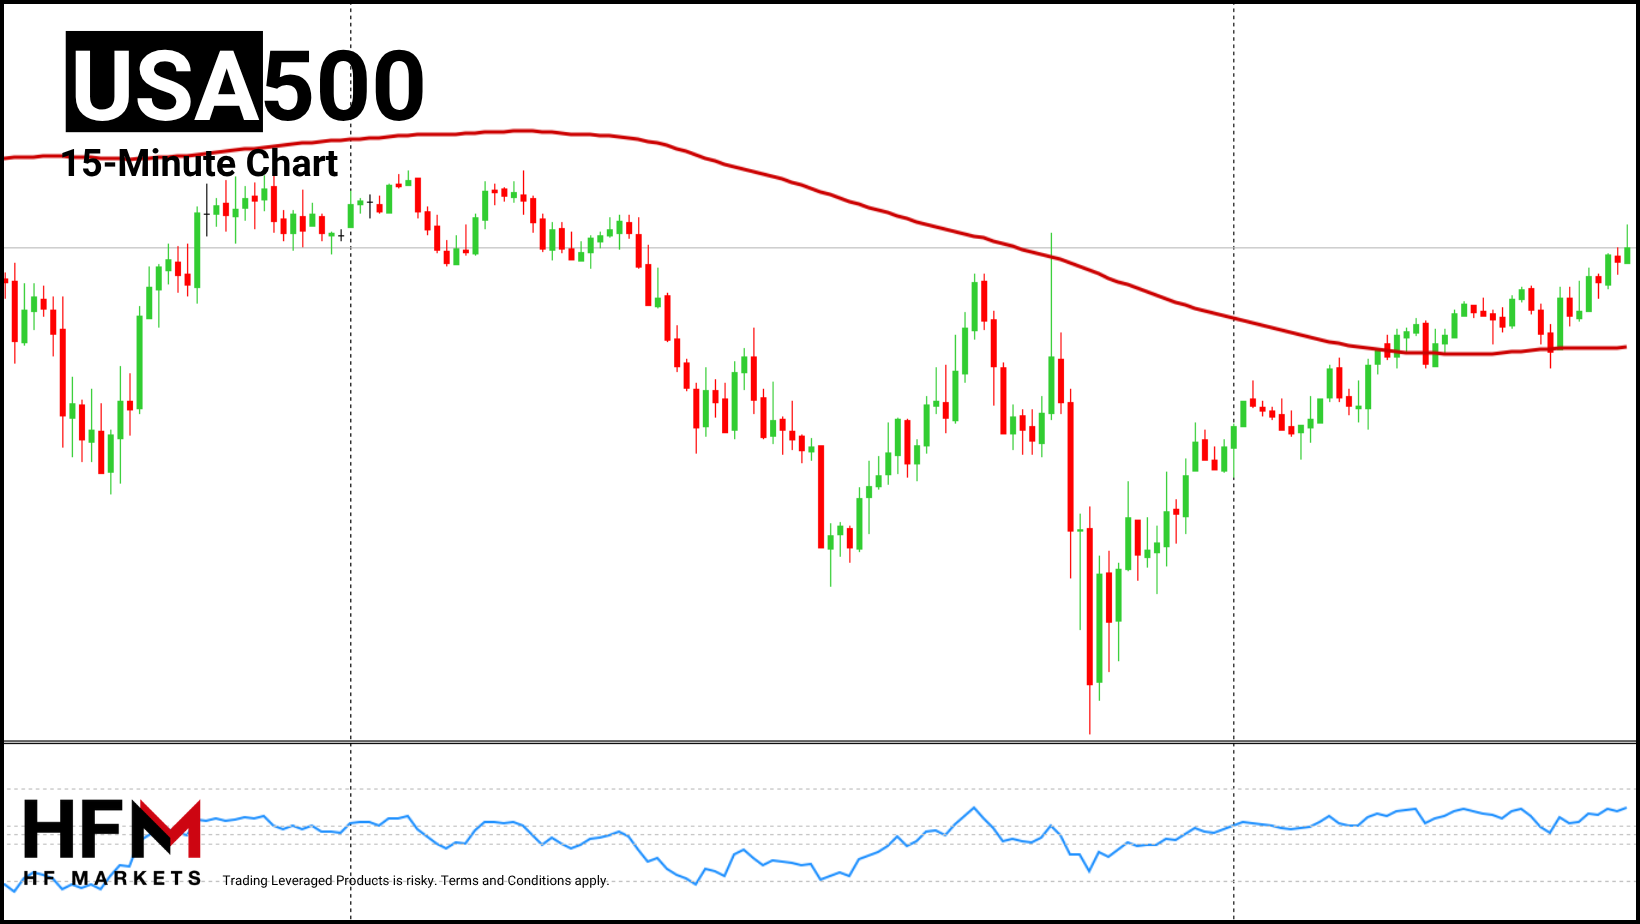
The S&P 500 is experiencing impulse waves in both directions as there clearly seems to be a tug-of-war between buyers and sellers. Nonetheless, bearish impulse waves remain slightly larger than bullish ones. Currently, the stock market is under pressure from the possibility of an AI slowdown, higher oil prices, geopolitical tensions, US-Canadian tariffs, and the possibility of multiple rate hikes.

The VIX Index trades slightly lower during this morning’s session, providing a slight positive for equities. However, the put-to-all ratio continues to indicate that sellers remain active.

In the short medium term, tonight’s Fed decision and press conference are likely to be the main price drivers. Currently, 93% of investors believe the Fed will hike tonight, but only 43% believe it will hike in October. If the possibility of an October rate hike increases, the stock market could continue to come under strain. Sell signals are likely to strengthen significantly if the price falls below $7,591.65. At this price, 65% of the retracement would have been lost, shifting momentum back in favour of sellers.

Gold Prices Spike Before Fed Decision

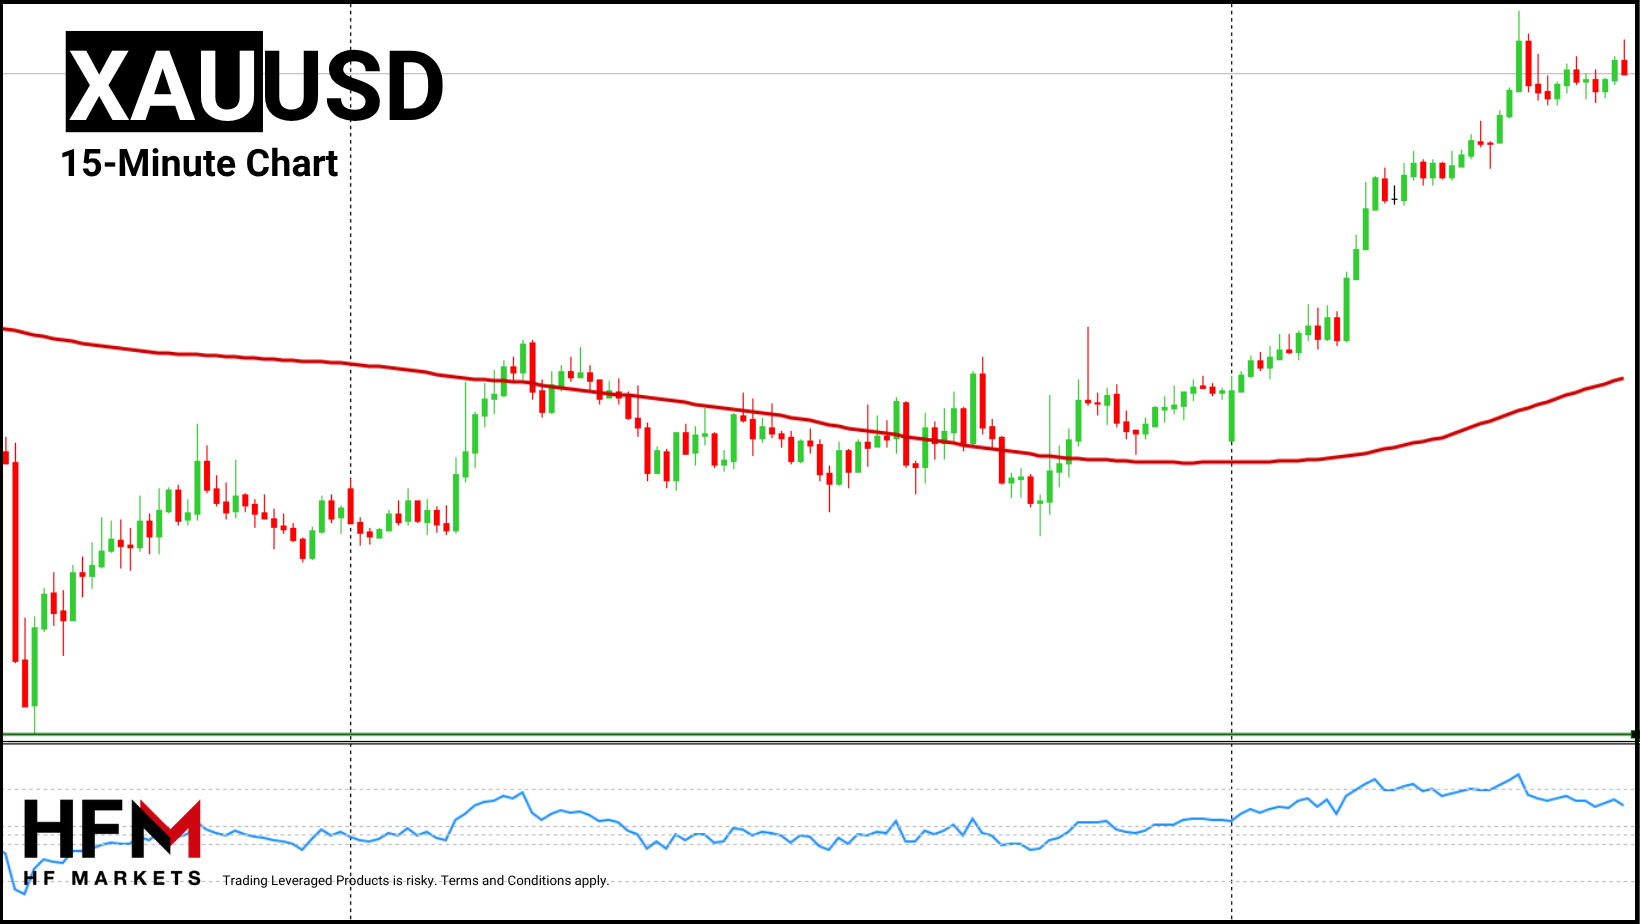
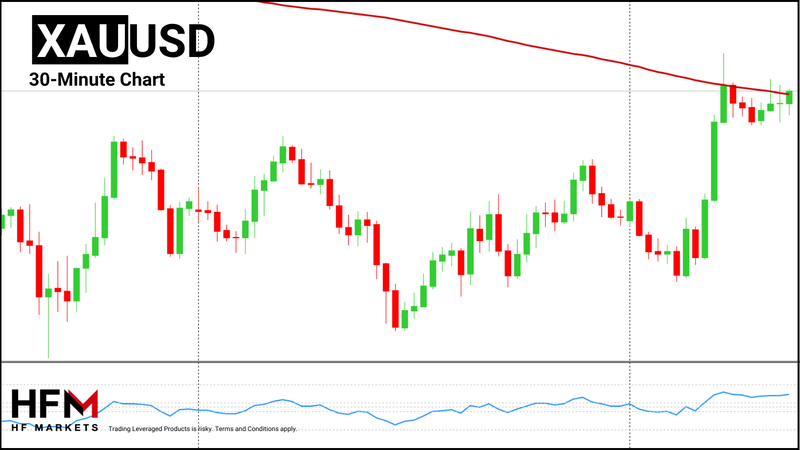
During this morning’s Asian session, Gold witnessed strong gains. However, volatility remains uncertain until the market obtains clarity from the Federal Reserve. However, Gold remains under pressure on certain timeframes despite attempting to rebound. With spot gold trading near $4,328 today, the immediate technical picture remains neutral to bearish while price stays below $4,360–$4,380. A sustained break above this resistance could open the door toward a more bullish outlook.

However, in the short term, the bullish momentum from this morning is pushing the price above moving averages and the VWAP. Therefore, on certain timeframes, the indications are bullish. If the price falls back below $4,303, bullish signals will also fade on smaller timeframes.

Image
HFM - Gold 30-Minute Chart

Key Takeaways:

* Markets are focused on the Federal Reserve’s rate decision and guidance on future hikes.
* The US Dollar remains supported, while GBP/USD faces pressure from weaker UK fundamentals.
* The S&P 500 remains vulnerable as sellers stay active ahead of the Fed announcement.
* Gold is attempting to recover, but remains below key resistance levels in the short term.

Always trade with strict risk management. Your capital is the single most important aspect of your trading business.

Please note that times displayed based on local time zone and are from time of writing this report.

Click HERE to access the full HFM Economic calendar.

Want to learn to trade and analyse the markets? Join our webinars and get analysis and trading ideas combined with better understanding of how markets work. Click HERE to register for FREE!

Click HERE to READ more Market news.

Michalis Efthymiou
HFMarkets


Disclaimer: This material is provided as a general marketing communication for information purposes only and does not constitute an independent investment research. Nothing in this communication contains, or should be considered as containing, an investment advice or an investment recommendation or a solicitation for the purpose of buying or selling of any financial instrument. All information provided is gathered from reputable sources and any information containing an indication of past performance is not a guarantee or reliable indicator of future performance. Users acknowledge that any investment in Leveraged Products is characterized by a certain degree of uncertainty and that any investment of this nature involves a high level of risk for which the users are solely responsible and liable. We assume no liability for any loss arising from any investment made based on the information provided in this communication. This communication must not be reproduced or further distributed without our prior written permission.
HotForex is an award winning, fully regulated and licensed online forex and commodities broker. Offers various accounts, trading software and trading tools to trade Forex and Commodities for individuals, fund managers and institutional customers.

HFblogNews
VideoBourse family
Messages : 2557
Inscription : 26 juin 2014, 12:48

Re: Analyses de Marchés

#903 Message par HFblogNews »

Date: 17th September 2026.

A Hawkish Fed Hike: What’s Next For the Market?

Image
Trading Leveraged products is Risky

The Federal Reserve hiked interest rates for the first time in three years, but what does it mean for the market? The US central bank has raised its Federal Funds Rate from 3.75% to 4.00%. Markets traditionally consider a rate above 4.00% to be restrictive. Markets are broadly interpreting the press conference after the rate decision as hawkish.

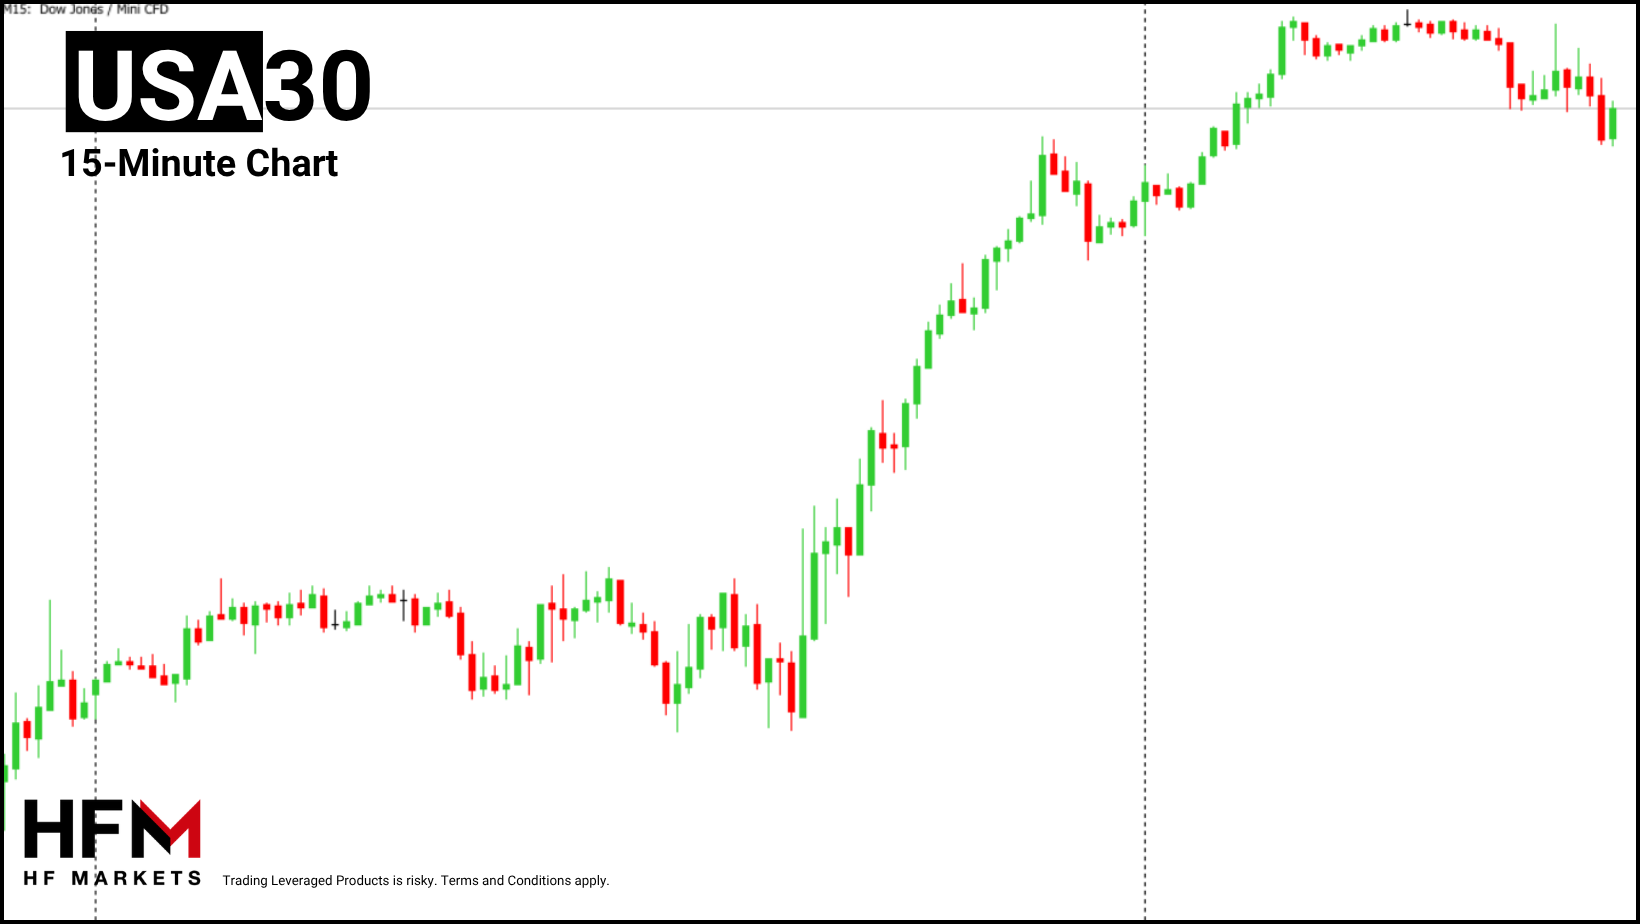
In response, the US Dollar Index rose 0.70% and is yet to form a bearish correction. Gold fell more than 3.00% due to the Fed’s stance but has since risen by 1.40%. Lastly, the S&P 500 fell almost 1.60% but has almost fully regained its losses. Nonetheless, the Fed’s hawkish stance is generally considered to be negative for both Gold and the stock market.

Federal Reserve Rate Hike and Hawkish Press Conference - US Dollar Index

The Federal Reserve raised its main rate from 3.75% to 4.00% in line with market expectations. However, despite the market pricing in a rate hike, the US Dollar Index still rose 0.20% immediately after the change. The subsequent press conference and dot plot helped maintain momentum throughout the US and Asian sessions.. The Dollar has been slightly weakening as the European open edges closer.

An important factor to the Dollar’s rise was the fact that the decision was unanimous. There was a 95% chance of the Fed increasing rates, according to most exchanges. However, most economists believed some of the dovish members might stick to the decision to hold. All 12 members voted for a rate hike.

The dot plot was also one of the most hawkish signals. The September projections showed that 16 of 18 policymakers expect at least one additional 25-basis-point hike before the end of 2026. The median projection puts rates at around 4.00-4.25% by year-end, versus the new 3.75–4.00% range today. Oil prices remain above $100 per barrel, meaning that the current hawkish signal may become even stronger in October.

Kevin Warsh’s press conference was clearly hawkish, but analysts do not class it as aggressively hawkish. Nonetheless, Mr Warsh told journalists that the economy is strong and becoming more resilient over the years. In addition to this, the Fed chair told the market that the ‘the economy is not the problem, inflation is’. Lastly, this morning the former Fed governor told Bloomberg that three rate hikes over the next 12-months sounds too high.

GBP/USD - BoE to Opt for a Hawkish Pause?

Most economists continue to believe the Bank of England will pause but may have a slight hawkish tilt. The Pound Index is witnessing no gains or losses, while the US Dollar is seeing a slight gain this morning. Most of the Dollar’s bullish price movement was seen yesterday evening after the Fed’s rate decision. The GBP/USD will continue to be under the influence of the hawkish Fed up to the upcoming NFP and inflation data. However, in the short-term, today’s Monetary Policy Committee’s votes are likely to trigger the main volatility.

Currently, markets are expecting three members of the MPC to vote for a hike, while six vote for a pause. If only two vote for a hike, the GBP could come under immense pressure. If more than three vote for a hike, the GBP/USD could attempt a full price correction despite the difference in the countries’ monetary policies.

Image
HFM - GBPUSD 30-Minute Chart

The GBP/USD is showing a bearish technical structure across all main timeframes. On the 5-minute chart, momentum remains negative, although the pair is becoming oversold, meaning a short-term corrective rebound is possible before sellers potentially return. The 30-minute chart shows a bearish trend, with the price trading below its key short-term moving averages and continuing to form lower highs and lower lows. On the daily chart, the exchange rate has broken beneath the 200-day moving average, strengthening the bearish technical outlook.

In the short-term, sell signals are likely to remain unless the price rises above 1.33865, and buy signals are unlikely to materialise unless the price rises above the 200-bar moving average at 1.33980.

Key Takeaways:

* The Federal Reserve delivered its first rate hike in three years, moving policy into a more restrictive range.
* A unanimous vote and the Fed dot plot indicate a further hike, helping push the US Dollar higher.
* Gold and stocks initially came under pressure. Gold fell sharply and the S&P 500 declined after the decision, although both later recovered part of their losses.
* The GBP/USD is under pressure from the stronger Dollar, while today’s Bank of England vote split could drive the next major move.

Always trade with strict risk management. Your capital is the single most important aspect of your trading business.

Please note that times displayed based on local time zone and are from time of writing this report.

Click HERE to access the full HFM Economic calendar.

Want to learn to trade and analyse the markets? Join our webinars and get analysis and trading ideas combined with better understanding of how markets work. Click HERE to register for FREE!

Click HERE to READ more Market news.

Michalis Efthymiou
HFMarkets


Disclaimer: This material is provided as a general marketing communication for information purposes only and does not constitute an independent investment research. Nothing in this communication contains, or should be considered as containing, an investment advice or an investment recommendation or a solicitation for the purpose of buying or selling of any financial instrument. All information provided is gathered from reputable sources and any information containing an indication of past performance is not a guarantee or reliable indicator of future performance. Users acknowledge that any investment in Leveraged Products is characterized by a certain degree of uncertainty and that any investment of this nature involves a high level of risk for which the users are solely responsible and liable. We assume no liability for any loss arising from any investment made based on the information provided in this communication. This communication must not be reproduced or further distributed without our prior written permission.
HotForex is an award winning, fully regulated and licensed online forex and commodities broker. Offers various accounts, trading software and trading tools to trade Forex and Commodities for individuals, fund managers and institutional customers.

HFblogNews
VideoBourse family
Messages : 2557
Inscription : 26 juin 2014, 12:48

Re: Analyses de Marchés

#904 Message par HFblogNews »

Date: 18th September 2026.

Why Is the Japanese Yen Falling After the BoJ Rate Hike?

Image
Trading Leveraged products is Risky

The Bank of Japan has raised rates to their highest level since the 1990s, but the Japanese Yen is still declining? The US Dollar rose 0.75% against the Japanese Yen in the hours after the announcement. The Japanese Yen is currently the worst-performing currency of the day and the week. Why is the Japanese Yen declining?

Bank of Japan - Rate Hike Not Enough When Global Banks Outpace You

The Bank of Japan’s main interest rate has risen from 1.00% to 1.25%, the highest since 1995. The BoJ has also hiked the fastest pace since 1990. Hikes and higher interest rates are traditionally positive for the currency. However, the Japanese Yen is coming under immense pressure in the short term.

The main reason for the decline is the split decision and the general central bank stance in September. In September, the Federal Reserve, European Central Bank, as well as others, took a relatively hawkish tone. As a result, economists believe most central banks will continue hiking in autumn and winter. Therefore, for the Japanese Yen to gain, the Bank of Japan needed to sound equally hawkish.

The main issue for the market was the split decision. The Federal Reserve and European Central Bank made unanimous decisions to increase rates, whereas the Bank of Japan’s voting committee saw two members vote for a pause, not a hike. Toichiro Asada and Ayano Sato voted against the hike, signalling some resistance to accelerating the pace of rate increases to the fastest level in more than three decades.

Previously, investors were expecting a rate hike from the BoJ, with a further hike in December. Now, the market is likely to remove the pricing for an additional hike. Lastly, the BoJ is expected to keep rates unchanged for the rest of the year, while other central banks may raise rates by another 0.25%. This wider interest-rate gap could weaken the Japanese Yen and make it more attractive again for carry trades.

Lastly, the Japanese Yen was trading more than 5% higher against the US Dollar meaning investors looking to buy would have found the USD/JPY attractive. Technical analysis for the Japanese Yen will follow below.


USD/JPY - Technical Analysis

Image
HFM - USDJPY 15-Minute Chart

On the 5-minute and 30-minute charts, USD/JPY remains strongly bullish following the BoJ decision. The price is clearly trading above key moving averages and at elevated levels on oscillators. Short-term momentum remains positive, although the sharp rise has pushed the market into overbought territory. Even though the RSI indicates that the price is overbought, price action will not indicate a bearish move unless the price falls below 156.870.

On the 4-hour chart, the broader recovery remains bullish after USD/JPY rebounded from 152.89 earlier this month and broke above the important 156.50 resistance area. Holding above this level would keep buyers in control, with 157.70-158.00 becoming the next area to watch. However, a move back below 156.50, and particularly below 155.45, would weaken the bullish structure and increase the possibility of a deeper correction.

GBP/JPY - Technical Analysis

The British Pound is also one of the weakest-performing currencies of the week, and the Bank of England was one of the only central banks to pause in September.

Nonetheless, on the 5-minute and 30-minute charts, GBP/JPY is showing strong bullish momentum following the BoJ decision. Moving averages are firmly positive and momentum indicators remain bullish, although the RSI has moved into overbought territory, suggesting the possibility of a short-term pullback. Immediate resistance is around 210.10-210.35, followed by 210.70, while 209.40 and 208.80 are the main short-term support areas.

On the 4-hour chart, the broader structure also remains bullish, supported by the latest breakout above 209.00. As long as GBP/JPY holds above 208.50-209.00, buyers remain in control, and a sustained break above 210.35-210.70 could open the way for further upside.

Image
HFM - GBPJPY 30-Minute Chart

Key Takeaways:

* The BoJ raised its policy rate to 1.25%, the highest level since 1995.
* The Yen weakened as the split vote reduced expectations for further near-term rate hikes.
* A wider interest-rate gap with other major central banks could continue to pressure the Yen.
* USD/JPY and GBP/JPY remain technically bullish, although short-term momentum is approaching overbought levels.

Always trade with strict risk management. Your capital is the single most important aspect of your trading business.

Please note that times displayed based on local time zone and are from time of writing this report.

Click HERE to access the full HFM Economic calendar.

Want to learn to trade and analyse the markets? Join our webinars and get analysis and trading ideas combined with better understanding of how markets work. Click HERE to register for FREE!

Click HERE to READ more Market news.

Michalis Efthymiou
HFMarkets


Disclaimer: This material is provided as a general marketing communication for information purposes only and does not constitute an independent investment research. Nothing in this communication contains, or should be considered as containing, an investment advice or an investment recommendation or a solicitation for the purpose of buying or selling of any financial instrument. All information provided is gathered from reputable sources and any information containing an indication of past performance is not a guarantee or reliable indicator of future performance. Users acknowledge that any investment in Leveraged Products is characterized by a certain degree of uncertainty and that any investment of this nature involves a high level of risk for which the users are solely responsible and liable. We assume no liability for any loss arising from any investment made based on the information provided in this communication. This communication must not be reproduced or further distributed without our prior written permission.
HotForex is an award winning, fully regulated and licensed online forex and commodities broker. Offers various accounts, trading software and trading tools to trade Forex and Commodities for individuals, fund managers and institutional customers.

HFblogNews
VideoBourse family
Messages : 2557
Inscription : 26 juin 2014, 12:48

Re: Analyses de Marchés

#905 Message par HFblogNews »

Date: 21st September 2026.

Bitcoin Price Hits $85K as Stocks Rally: Can BTC Reach $90K?.
Image
Trading Leveraged products is Risky

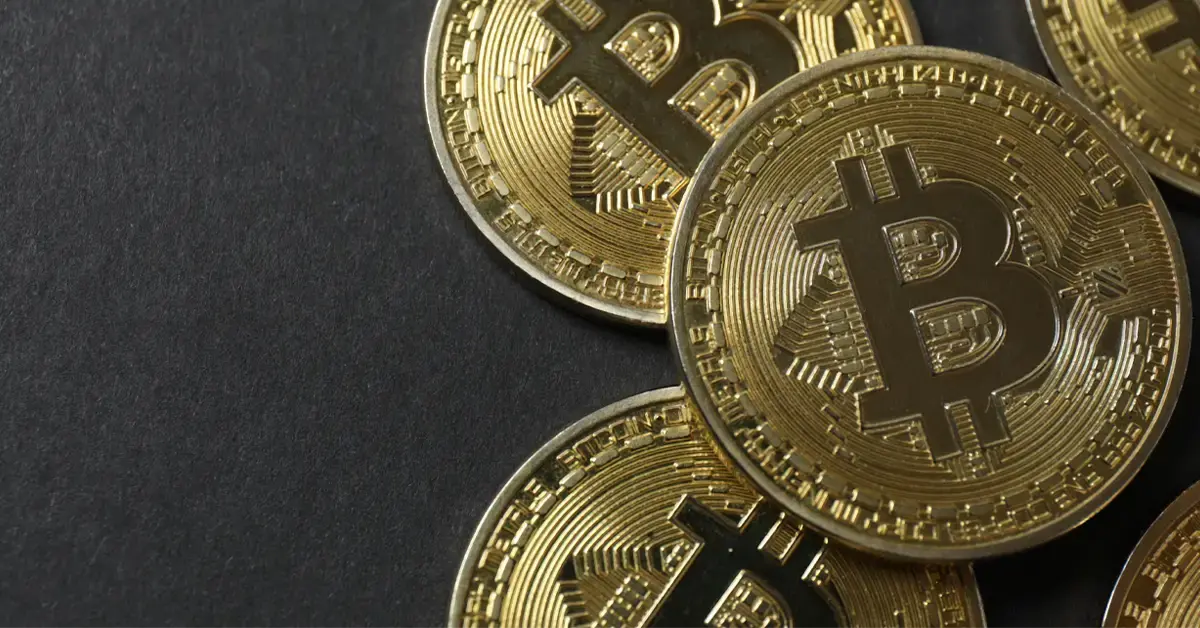
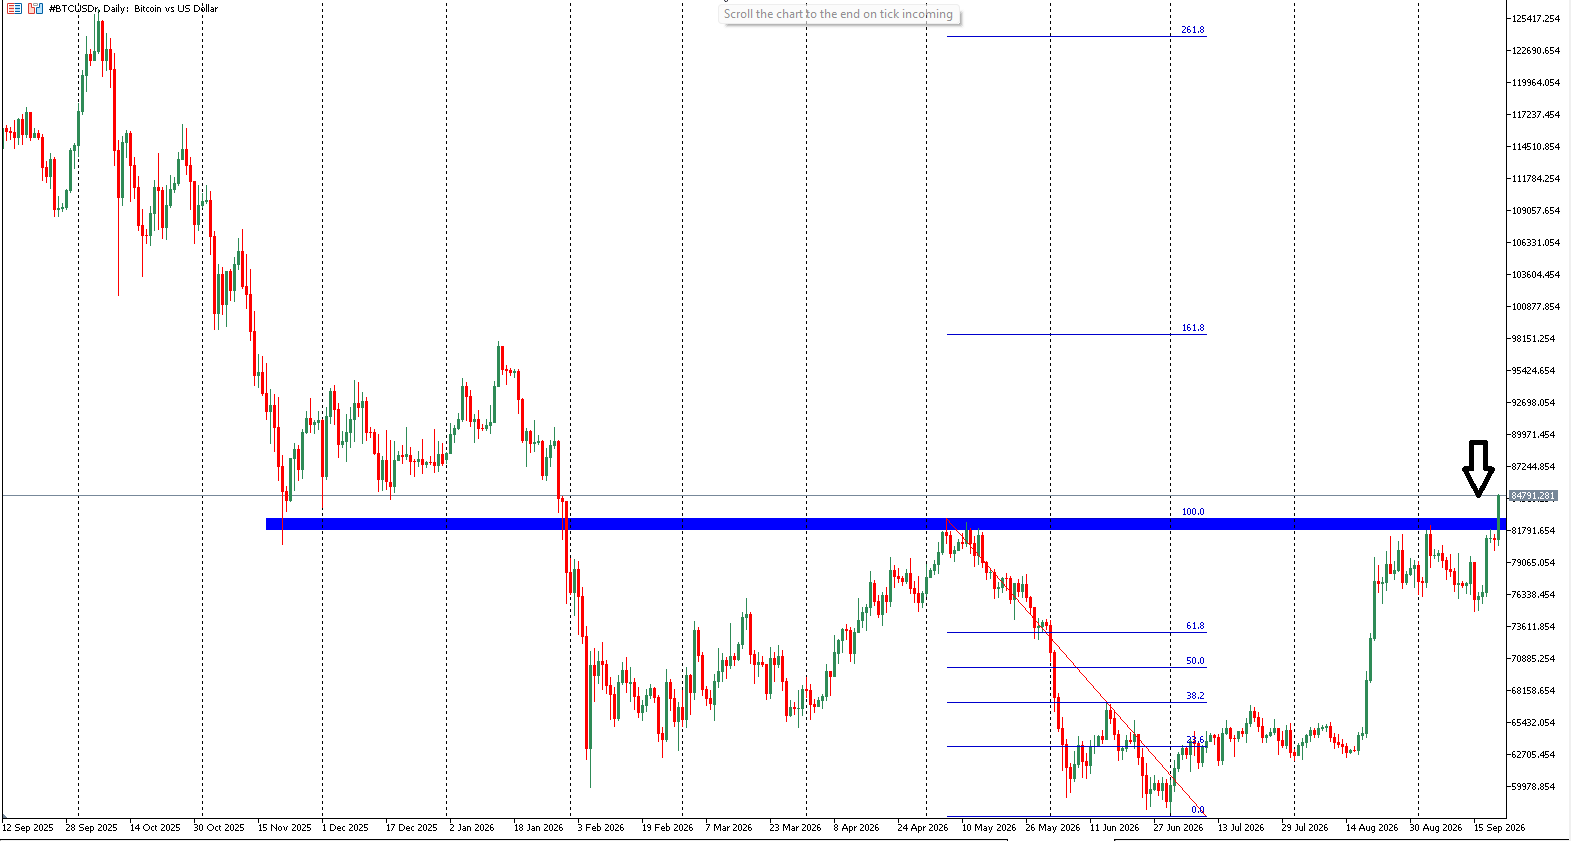
The Bitcoin price climbed to $85,000 for the first time in eight months on Monday, extending a sharp recovery from below $80,000 as technology stocks rallied and oil prices moved lower. The move puts Bitcoin at an important technical crossroads and raises a broader question for traders: is the latest surge simply a cryptocurrency breakout, or is a wider risk-on trade developing across global markets?

Bitcoin is not rallying alone. US equity futures advanced on Monday, led by technology and AI-related stocks, while Asian share markets also moved higher. At the same time, crude oil prices declined by around 2%, helping Treasury yields ease after the sharp rise seen over recent weeks.

This combination is particularly interesting because the rally is taking place despite a more restrictive monetary environment. The Federal Reserve raised interest rates last week, bond yields remain elevated and markets continue to consider the possibility of additional tightening. Yet Bitcoin has moved through $85,000 and technology shares are once again attracting buyers.

For traders, the interaction between Bitcoin, the Nasdaq, oil and US Treasury yields may therefore provide a better indication of whether the rally can continue than Bitcoin's price alone.

Bitcoin Price Breaks $85,000: Why the Level Matters

Bitcoin's move to $85,000 comes only days after the cryptocurrency traded below $80,000, highlighting how quickly short-term momentum has changed.

The $85,000 level carries more significance than an ordinary point on the chart. It is a major round-number price, represents a fresh high for the recovery and marks a level Bitcoin has not reached for eight months. These psychological levels often attract additional activity because traders may use them to take profits, initiate new positions or adjust existing exposure.

Reaching $85,000 therefore demonstrates strong buying momentum, but the next test is whether Bitcoin can remain above it. A brief move through resistance followed by a sharp reversal would indicate that sellers are still active around the level. By contrast, a daily close above $85,000 followed by buyers defending the area during subsequent pullbacks would provide stronger evidence that previous resistance is turning into support.

The rally is also notable because Bitcoin has absorbed several potentially negative developments. The Federal Reserve raised rates last week, while the US Senate failed to advance the CLARITY Act, which had been intended to establish a broader regulatory framework for digital assets. The legislation collapsed after months of negotiations and disagreement between lawmakers, banking groups and parts of the crypto industry.

Bitcoin initially experienced volatility around these developments but ultimately recovered. That reaction matters because markets sometimes reveal more through their response to negative news than through the news itself. When an asset absorbs bearish developments without extending its decline, it can indicate that selling pressure is becoming less effective.
Image

Bitcoin ETF Inflows Recovered as BTC Broke Higher

Institutional demand provides another important part of the current Bitcoin outlook.

US spot Bitcoin ETFs recorded a modest $6.1 million net inflow between September 14 and September 18, but the weekly total hides considerable volatility underneath. The funds attracted $159.9 million on Monday before investors withdrew $450.4 million on Tuesday and another $295.9 million on Wednesday, producing combined midweek outflows of more than $746 million.

The picture changed sharply toward the end of the week. Bitcoin ETFs attracted $159.5 million on Thursday before inflows accelerated to $433 million on Friday. Fidelity's FBTC accounted for $310.7 million of Friday's buying, while BlackRock's IBIT contributed another $108.4 million.

The weekly total was therefore close to flat, but the direction of institutional demand changed significantly during the final two sessions.

For traders, the next ETF flow reports could be particularly important now that Bitcoin has reached $85,000. Continued inflows alongside a sustained breakout would suggest institutional demand is supporting the move. A return to significant withdrawals, on the other hand, could make traders more cautious about the durability of the rally.

ETF flows should not be viewed as the only measure of Bitcoin demand, since they represent activity in US-listed funds rather than the entire global market. However, the strong recovery in flows at the end of last week makes them an important indicator to monitor as Bitcoin attempts to establish itself above $85,000.

Why Are Bitcoin and Stocks Rallying Together?

Bitcoin's breakout is occurring alongside a broader improvement in equity sentiment.

US stock futures moved higher on Monday, with Nasdaq futures gaining more than 1% during early trading as AI-related and technology shares led the advance. Asian equity markets also strengthened, particularly in technology-heavy South Korea and Taiwan.

This suggests Bitcoin's rally may not be purely crypto-specific. Instead, several risk-sensitive assets appear to be benefiting from an improvement in investor sentiment.

Bitcoin and technology stocks are fundamentally different assets, but both can be highly sensitive to changes in financial conditions. Technology company valuations are particularly affected by interest rates because a large proportion of their value can depend on expected future earnings. Higher bond yields increase the discount rate applied to those earnings, while falling yields can provide some relief.

Bitcoin does not generate traditional corporate earnings, but its performance has also frequently been influenced by global liquidity, interest-rate expectations and broader investor appetite for risk. When investors become more willing to hold higher-volatility assets, both cryptocurrencies and technology shares can benefit.

This is where another market like crude oil, becomes particularly important.

Falling Oil Could Be Helping Bitcoin and the Nasdaq

Oil prices declined to an 11-day low on Monday as markets reacted to expectations of potential diplomatic progress involving Iran and signs of a partial recovery in Saudi oil shipments. Brent crude fell by around 2%, while WTI also moved lower.

For equity and cryptocurrency traders, the significance of lower oil prices extends beyond the energy market.

Oil is an important component of global inflation. Sustained increases in crude prices raise transportation and production costs and can eventually feed through to consumer prices. When inflation pressure rises, investors may expect central banks to maintain higher interest rates or tighten monetary policy further.

The reverse can also occur. If oil prices continue to decline, some of the inflation pressure facing central banks could ease. On Monday, the decline in crude contributed to lower US Treasury yields while equity futures moved higher.

This creates an important cross-market relationship for traders: lower oil can reduce inflation concerns, which can ease pressure on bond yields and create a more supportive environment for risk-sensitive assets such as technology stocks and Bitcoin.

The relationship is not automatic, and many other factors influence these markets. However, as long as oil and Treasury yields remain under pressure while Bitcoin and equities move higher, the broader risk-on argument gains additional support.

The Federal Reserve Remains the Main Challenge

The major contradiction in the current rally is that monetary policy remains restrictive.

The Federal Reserve recently delivered its first rate increase in more than three years, while expectations of further tightening have remained present in financial markets. Bond yields have also risen considerably, creating more challenging financial conditions for both consumers and companies.

Bitcoin and technology stocks are therefore not rallying because markets suddenly expect aggressive monetary easing. Instead, they are advancing despite a hawkish Fed.

That makes Treasury yields particularly important in determining what happens next.

If yields stabilise or continue to fall as oil prices retreat, one of the biggest macroeconomic pressures facing risk assets would become less severe. Bitcoin and technology stocks could potentially benefit from that environment.

However, if bond yields resume their climb, the rally could face another significant test. Higher yields make lower-risk fixed-income assets relatively more attractive while increasing financing costs and placing additional pressure on high-valuation growth assets.

The current market is therefore testing whether improving risk sentiment can overcome restrictive monetary conditions.

Trump-Xi Summit Adds Another Market Catalyst

Another important event this week is the meeting between US President Donald Trump and Chinese President Xi Jinping.

Xi is scheduled to visit the United States from September 23 to September 25, with Trump and Xi set to meet at the White House on Thursday, September 24. Trade relations are expected to be among the major subjects under discussion.

Markets have been paying close attention to US-China relations because changes in tariffs and trade policy can influence global growth expectations, supply chains and technology companies in particular. The summit is therefore another potential source of volatility for equities and, indirectly, broader investor risk sentiment.

For traders, the focus will be on concrete developments emerging from the meeting rather than simply whether diplomatic language appears positive or negative. Any material changes involving trade or other economic measures could influence stocks, currencies and commodities and potentially spill over into cryptocurrency sentiment.

Bitcoin's breakout is therefore occurring just as another potentially significant macroeconomic catalyst approaches.
Image

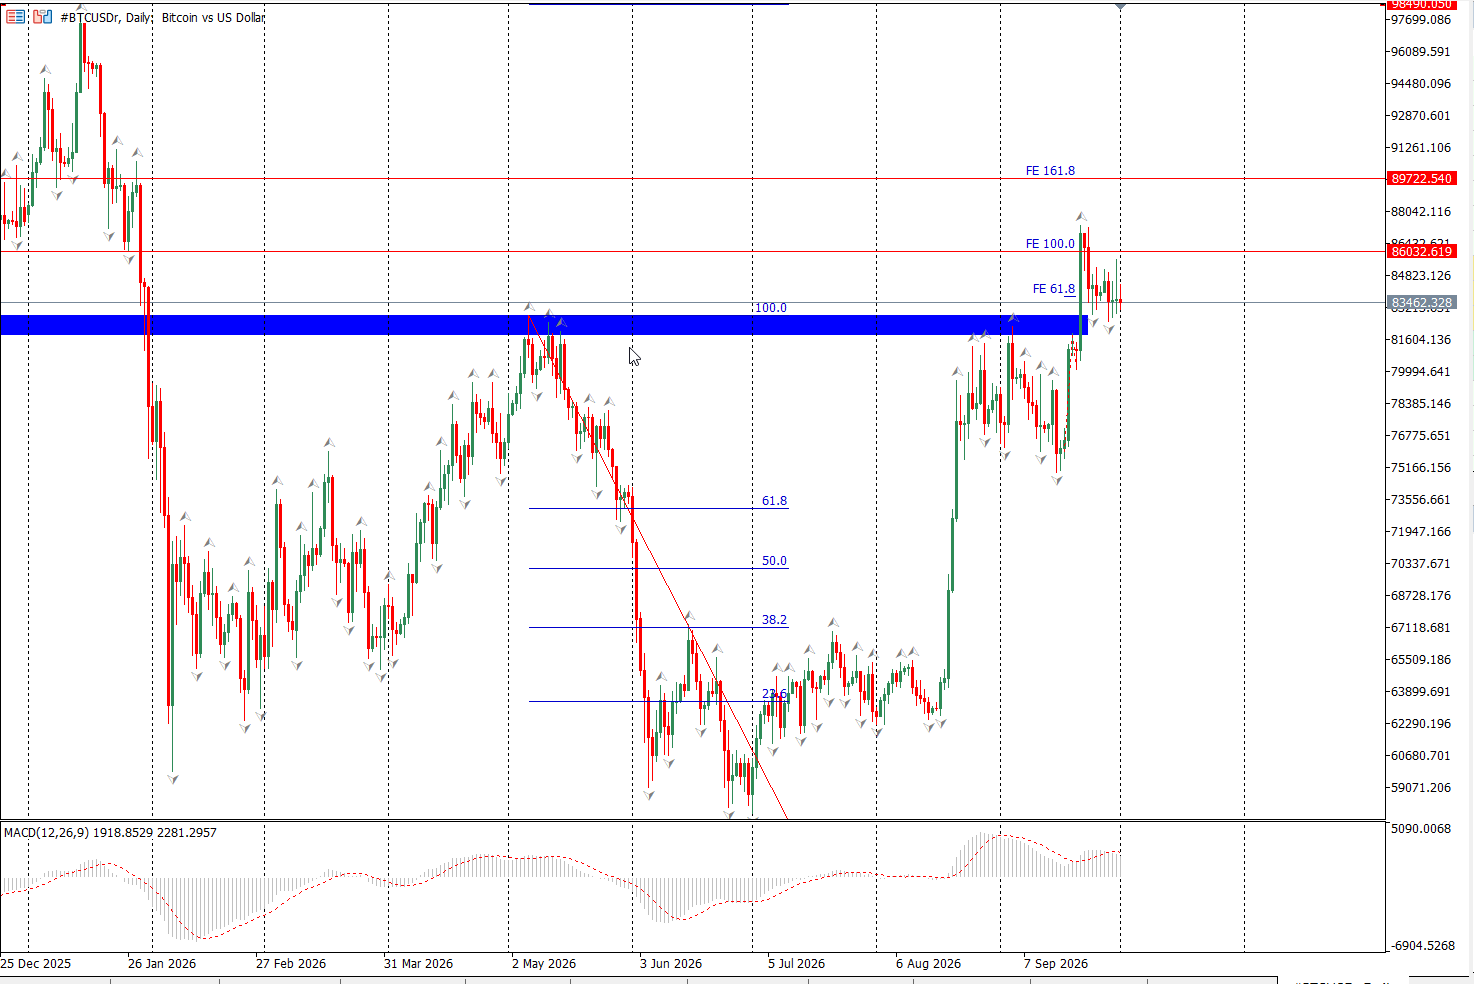
Bitcoin Technical Analysis: Can $85,000 Become Support?

From a technical perspective, Bitcoin reaching $85,000 shifts the question from whether the cryptocurrency can reach resistance to whether it can establish itself above it.

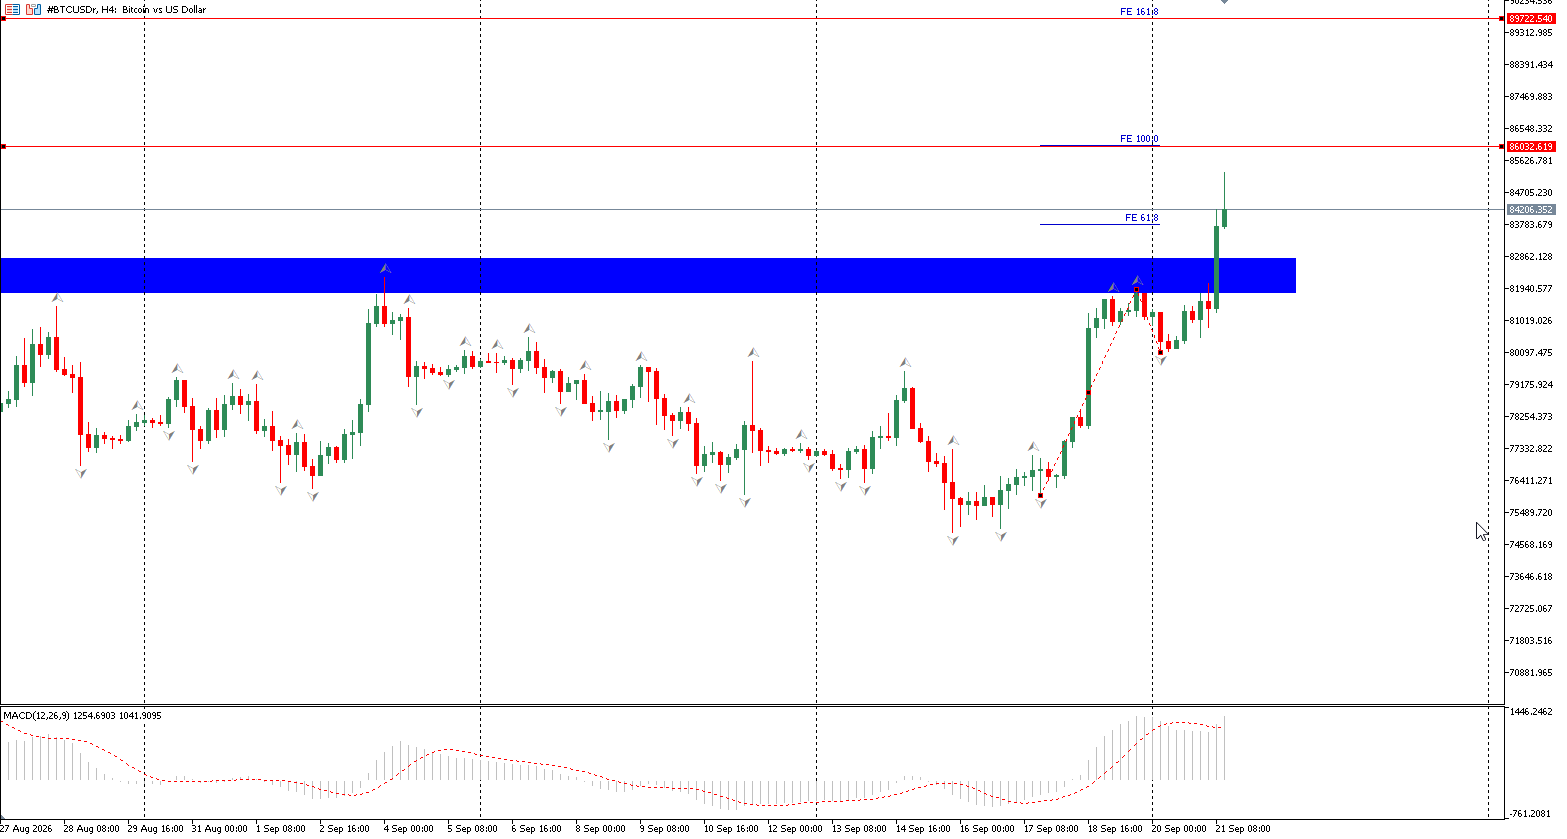
Trading activity has increased substantially alongside the rally. Bitcoin futures trading volume has risen by more than 60% over the past 24 hours to approximately $78.6 billion, indicating greater participation as BTC tests the breakout area.

Momentum indicators are also strong. The daily Relative Strength Index has reached approximately 70, placing Bitcoin in the traditionally overbought region, while the MACD remains firmly in positive territory.

An RSI around 70 does not necessarily mean Bitcoin must reverse. During strong trends, markets can remain overbought for extended periods as momentum traders continue entering the market. However, elevated momentum indicators increase the importance of watching whether price action begins to weaken or diverge from the indicators.

The first major level is now $85,000. A firm daily close above it, followed by continued trading above the level, would strengthen the breakout case and shift attention toward the next psychological target.

That target is $90,000.

If Bitcoin can establish itself above $90,000, the market would increasingly begin to focus on $100,000. However, six figures should not be treated as an automatic destination. Bitcoin would still need to absorb potential selling between $90,000 and $100,000, and stronger ETF demand alongside supportive broader financial conditions would make the technical case more convincing.

On the downside, a rapid return below $85,000 would indicate that sellers have successfully defended the breakout area. In that scenario, $80,000 would become the next major psychological level to monitor. A sustained move below $80,000 would weaken the near-term bullish structure considerably.

What Should Traders Watch Next?

The next phase of Bitcoin's move may become clearer by analysing several markets together.

If Bitcoin holds above $85,000 while ETF inflows continue, the immediate technical picture would remain constructive. If Nasdaq and other technology shares advance at the same time, that would suggest the rally is receiving confirmation from broader investor risk appetite rather than being confined to cryptocurrency markets.

Oil and Treasury yields provide the other side of the equation. Continued weakness in crude could reduce inflation concerns, while stable or falling yields would ease some of the pressure created by restrictive monetary policy.

The strongest cross-market confirmation would therefore be a combination of Bitcoin holding above $85,000, technology stocks continuing to rise, oil remaining under pressure and Treasury yields stabilising or falling.

A reversal in those relationships would warrant greater caution. A renewed surge in oil, another sharp increase in bond yields and weakening Bitcoin ETF demand could make it considerably more difficult for BTC to sustain its breakout.

Can Bitcoin Reach $90,000 and Eventually $100,000?

Bitcoin's move to $85,000 after trading below $80,000 only days earlier represents a significant change in short-term momentum. The recovery in ETF demand, stronger equity markets and decline in oil prices have created a more supportive environment for the cryptocurrency.

However, several risks remain. The Federal Reserve continues to maintain a restrictive stance, Treasury yields remain elevated, Bitcoin's momentum indicators are stretched and geopolitical developments could quickly change investor sentiment.

For now, $85,000 is the key level determining whether Bitcoin's breakout can develop into a larger move. Holding above it would keep $90,000 in focus, while a successful move through $90,000 could gradually strengthen the technical case for a future test of $100,000.

For traders, though, Bitcoin's chart should not be viewed in isolation. The more important story may be developing across markets.

If Bitcoin and technology stocks continue rising while oil falls and Treasury yields remain contained, the current move would increasingly resemble a broader risk-on rotation. If those relationships begin to reverse, Bitcoin's $85,000 breakout could face its first serious test.

Always trade with strict risk management. Your capital is the single most important aspect of your trading business.

Please note that times displayed based on local time zone and are from time of writing this report.

Click HERE to access the full HFM Economic calendar.

Want to learn to trade and analyse the markets? Join our webinars and get analysis and trading ideas combined with better understanding of how markets work. Click HERE to register for FREE!

Click HERE to READ more Market news.

Andria Pichidi
HFMarkets


Disclaimer: This material is provided as a general marketing communication for information purposes only and does not constitute an independent investment research. Nothing in this communication contains, or should be considered as containing, an investment advice or an investment recommendation or a solicitation for the purpose of buying or selling of any financial instrument. All information provided is gathered from reputable sources and any information containing an indication of past performance is not a guarantee or reliable indicator of future performance. Users acknowledge that any investment in Leveraged Products is characterized by a certain degree of uncertainty and that any investment of this nature involves a high level of risk for which the users are solely responsible and liable. We assume no liability for any loss arising from any investment made based on the information provided in this communication. This communication must not be reproduced or further distributed without our prior written permission.
HotForex is an award winning, fully regulated and licensed online forex and commodities broker. Offers various accounts, trading software and trading tools to trade Forex and Commodities for individuals, fund managers and institutional customers.

HFblogNews
VideoBourse family
Messages : 2557
Inscription : 26 juin 2014, 12:48

Re: Analyses de Marchés

#906 Message par HFblogNews »

Date: 22nd September 2026.

Gold: US-China Talks and Technical Analysis.

Image
Trading Leveraged products is Risky

Gold trades lower and is once again approaching the key $4,250 support level. Following the decline triggered by the Federal Reserve’s latest rate decision, the precious metal attempted to recover and initially posted a positive rebound. However, buyers failed to break through key resistance levels, causing momentum to fade.

Gold is now coming under renewed pressure from expectations of another interest-rate hike, strong corporate earnings, lower oil prices, and improving risk sentiment surrounding this week’s US-China talks. Gold prices have now been falling for two consecutive days, declining almost 2%.

US-China Talks Boost Sentiment And Pressure Gold

The US-China talks are having its ripple effect throughout most tradable assets, the two largest economies discuss AI, trade, and security. So far, the Chinese Vice President has met with the US Treasury Secretary. The US President, Donald Trump, and Chinese leaders will meet on Thursday.

The effect on Gold at the momentum is negative, as the talks are having a positive impact on investor sentiment. As investors believe tariffs could be reduced or the trade truce extended, fears of a major trade confrontation are decreasing. Investors are becoming more comfortable holding equities and other risk assets, reducing demand for Gold as a safe haven.

The key issue isn’t necessarily whether Washington and Beijing resolve everything. Current reporting suggests the talks are focused more on maintaining stability and extending existing arrangements. Nonetheless, extending these agreements on a positive note can provide stability. The market’s risk appetite is primarily driven by stability and the absence of fear. For this reason, Gold is failing to maintain bullish momentum.

However, if US-China relations deteriorate or the two sides fail to reach an agreement on an extension, Gold could suddenly rise again. This could reverse the current bearish indications seen on certain charts.

Gold Pressures - Rate Hike Expectations and Higher Bond Yields

In addition to the US-China talks, Gold is also facing pressure from a stronger US Dollar and higher Treasury yields. Expectations that US interest rates will remain higher for longer have supported the Dollar, making Gold more expensive for buyers using other currencies. At the same time, higher bond yields reduce some of Gold’s appeal compared with yield-bearing assets. As other yield-bearing investments perform well, the need for Gold as a safe-haven asset declines.

The Federal Reserve’s monetary policy outlook remains one of the biggest headwinds. Following its latest rate hike, markets are increasingly considering the possibility of another increase later this year. Last night, two members of the Federal Open Market Committee said an additional hike was possible. Expectations of tighter monetary policy support both the US Dollar and yields. This creates a challenging environment for Gold, which tends to thrive when yields are lower and risk sentiment weakens.

Lower oil prices have also removed some support for the precious metal. Falling energy prices can reduce inflation concerns and ease geopolitical risk premiums, weakening demand for Gold as both an inflation hedge and safe-haven asset. However, the decline is not yet enough to reduce expectations of further rate hikes.

At the same time, stronger equity markets and improving risk sentiment, helped by encouraging US-China trade discussions, have encouraged investors towards riskier assets. In addition, expectations of higher earnings and the AI trend continue to gain momentum. Together, stronger risk appetite, a firm Dollar, elevated yields, and expectations of further Fed tightening continue to keep Gold under pressure.

Gold - Technical Analysis

Image
HFM - Gold 30-Minute Chart

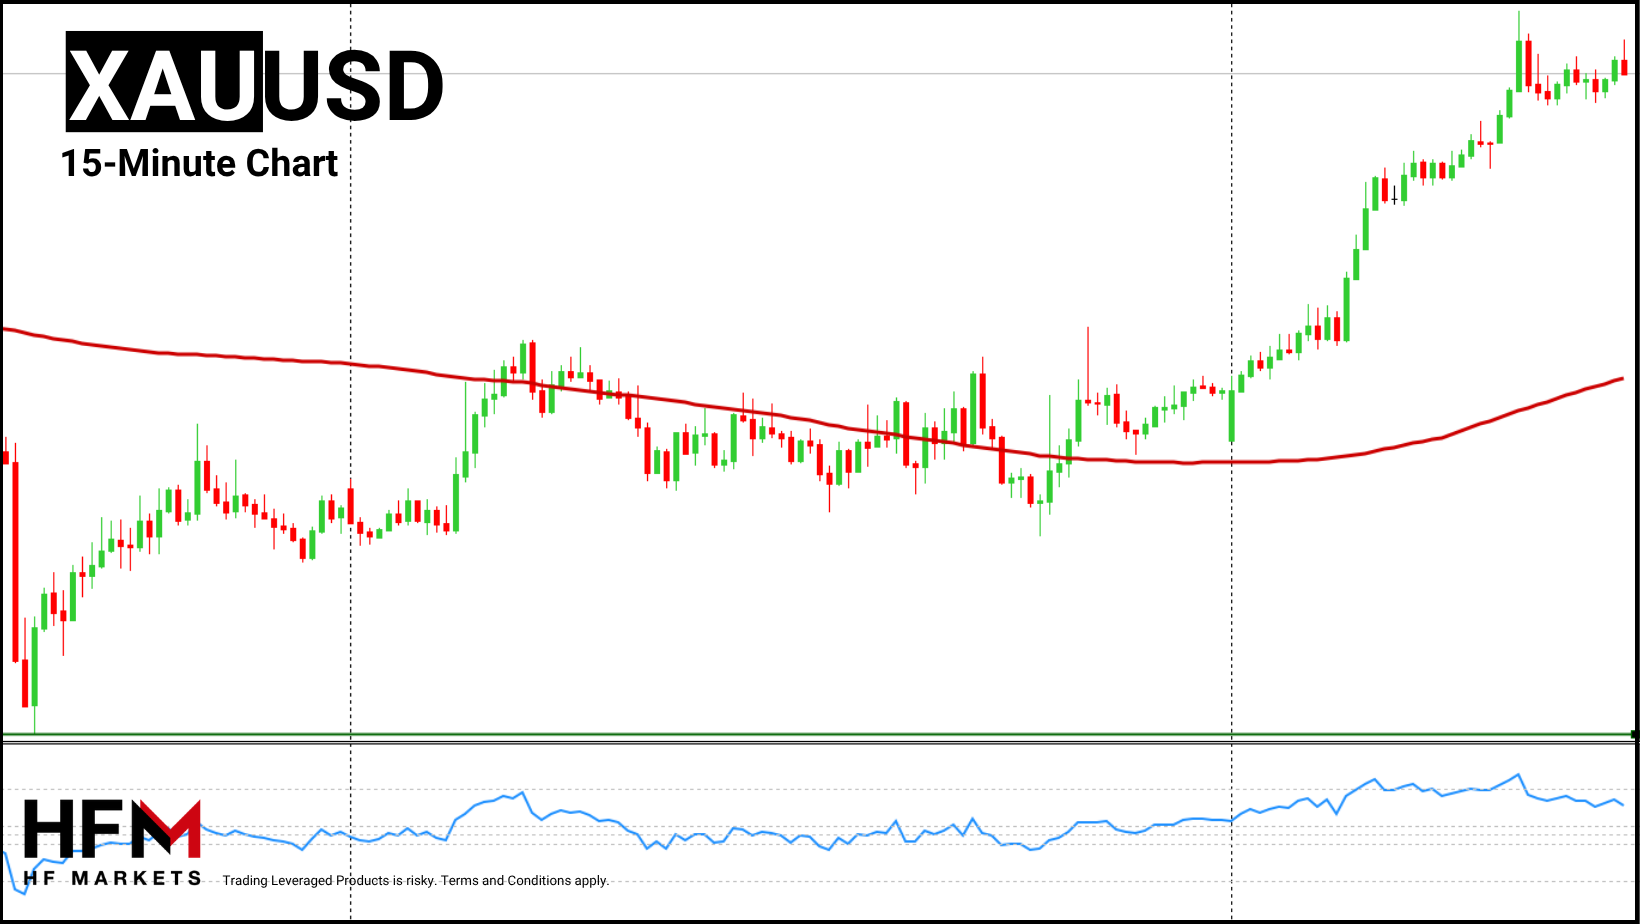
Gold has been trading lower throughout the Asian session and particularly during the first half of the European session. On most timeframes, the precious metal is showing a bearish bias. However, on smaller timeframes, such as the 1-minute and 5-minute charts, the price quickly spiked by 0.79%. At the same time, the US Dollar Index and bond yields recorded similar upward movements.

Nonetheless, on the larger timeframes, the price is trading with lower lows and lower highs despite the retracement. In addition, the price is trading below the key moving averages on all timeframes, but is at the RSI’s neutral level. If the price rises above $4,342.00, the asset will begin to trade above the 200-bar moving average, potentially indicating a bullish breakout. At this level, sell signals will not be visible on smaller timeframes. If the price falls back below $4,307.50, sell signals could strengthen again based on momentum indicators and price action.

Key Takeaway:

* Gold falls nearly 2% in two days, approaching the $4,250 support level.
* Higher bond yields, a stronger Dollar and further Fed hike expectations are pressuring Gold.
* Positive US-China talks are improving risk sentiment and reducing safe-haven demand.
* Technically, $4,342 is key resistance, while a move below $4,307.50 could strengthen bearish signals.

Always trade with strict risk management. Your capital is the single most important aspect of your trading business.

Please note that times displayed based on local time zone and are from time of writing this report.

Click HERE to access the full HFM Economic calendar.

Want to learn to trade and analyse the markets? Join our webinars and get analysis and trading ideas combined with better understanding of how markets work. Click HERE to register for FREE!

Click HERE to READ more Market news.

Michalis Efthymiou
HFMarkets


Disclaimer: This material is provided as a general marketing communication for information purposes only and does not constitute an independent investment research. Nothing in this communication contains, or should be considered as containing, an investment advice or an investment recommendation or a solicitation for the purpose of buying or selling of any financial instrument. All information provided is gathered from reputable sources and any information containing an indication of past performance is not a guarantee or reliable indicator of future performance. Users acknowledge that any investment in Leveraged Products is characterized by a certain degree of uncertainty and that any investment of this nature involves a high level of risk for which the users are solely responsible and liable. We assume no liability for any loss arising from any investment made based on the information provided in this communication. This communication must not be reproduced or further distributed without our prior written permission.
HotForex is an award winning, fully regulated and licensed online forex and commodities broker. Offers various accounts, trading software and trading tools to trade Forex and Commodities for individuals, fund managers and institutional customers.
HFblogNews
VideoBourse family
Messages : 2557
Inscription : 26 juin 2014, 12:48

Re: Analyses de Marchés

#907 Message par HFblogNews »

Date: 24th September 2026.

The 5% Problem: Why One Bond Yield Is Running Every Market Today.

Image
Trading Leveraged products is Risky

If you want to understand markets today, forget tickers for a moment and look at one number: 5.11%. That's where the US 10-year Treasury yield closed Wednesday, the highest since July 2007, and it kept climbing overnight toward 5.13%. Nearly every other story today, from Tokyo currency desks to European boardrooms, is a reaction to it.

The economy is running hot, and that's the problem

The spark came from an unlikely place: good news. S&P Global's flash Composite PMI jumped to 58.4 in September from 56.0, its strongest reading since mid-2021. In a normal year that would be cause for celebration. This year it landed on a market already nervous about inflation.

The details made it worse. Business input costs rose at their fastest pace in four years, pushed up by fuel and shipping, and supply-chain strain hit levels rarely seen outside the pandemic. Add Brent crude trading above $100 a barrel, and traders drew the obvious conclusion: price pressures aren't fading, so rates may have further to rise.

For investors, the uncomfortable shift is that 5% no longer looks like a ceiling. Some strategists are openly discussing 6%, and the point at which higher yields start actively hurting stocks may be close.

Wall Street: a slow leak, not a crash

Wednesday's session ended in the red across the board: the Nasdaq Composite fell 1.13%, the S&P 500 lost 0.75%, and the Dow gave up 0.68%. Futures were barely lower overnight, but the selling picked up into the European morning. Nasdaq-100 contracts were down about 0.5%, S&P 500 futures about 0.4%, and Dow futures about 0.2% ahead of the open.

Tech is taking the hardest hit, and that makes sense. Growth stocks are valued on profits far in the future, and higher yields make those future profits worth less today. Even a busy stretch of AI news hasn't been enough to offset that. Meta showed off new VR glasses and plans to monetize its Muse AI agent at its Connect event, and Alphabet signaled that Gemini 4 is close. Unity Software rose overnight on hopes it benefits from Meta's VR push.

The summit in the background

Today's biggest scheduled event is political. Chinese President Xi Jinping is in Washington for a three-day summit with President Trump, capped by a White House state dinner expected to include many of America's top tech and finance CEOs.

Some of the tension was defused before the meeting started. Treasury Secretary Scott Bessent said the two countries have extended their trade truce by two months, to January 10. That leaves AI competition, the war in Iran, and critical minerals as the main topics. A positive surprise on any of these could briefly lift sentiment, but it's hard to see a handshake outweighing a 5% bond yield.

Tokyo's line in the sand

The strong dollar is putting pressure on Japan. The yen has slid for two weeks and sits near 157.85 per dollar, uncomfortably close to 160, a level that has triggered official action before.

The Bank of Japan raised rates last week, but the governor's follow-up comments were less hawkish than traders hoped, so the yen kept weakening. The key question now is whether Washington would help again. The US joined Japan in buying yen this summer, and Bessent has repeatedly said he wants a stronger yen. If the currency tests 160, markets will find out whether he backs that up with action. Strategists are split on whether the threat alone will be enough.

Europe: strong earnings, rising bills

Europe presents a split picture. Analysts have been raising earnings estimates for months, the longest run of upgrades in over four years, and Stoxx 600 profits are expected to rise around 15% this year. Euro-area business activity just grew at its fastest pace in more than three years.

The market isn't fully convinced, though. The Stoxx 600 has drifted lower since mid-August, and higher borrowing costs are starting to squeeze companies that need to refinance debt. The ECB has already hiked once this month, and markets expect more. Europe's economic data is solid, but rising interest costs could eat into those earnings.

Bitcoin: the market's optimist

One asset seems to be ignoring the gloom. Bitcoin trades around $84,000, up more than 30% since August. The next test comes Friday, when roughly $15 billion in Deribit options expire. Heavy call positions at $85,000, $90,000, and $100,000 mean dealer hedging could cap rallies until the contracts settle. After expiry, that cap could come off.

What to watch before the bell

* Jobless claims : Another strong labor reading would add to the "rates higher for longer" story and push yields up further.
* The 10-year yield: If it holds above 5.1%, pressure on tech likely continues. A pullback would give stocks some relief.
* USD/JPY at 160: A move toward that level raises the odds of intervention, which could move the dollar sharply.
* Trump–Xi headlines: Mostly a sentiment story unless there's concrete progress on AI or critical minerals.

The takeaway: Today isn't really about any single company or summit. It's about whether markets can live with a 5% risk-free rate while inflation signals keep heating up. Until yields ease, rallies are likely to be short-lived.

Always trade with strict risk management. Your capital is the single most important aspect of your trading business.

Please note that times displayed based on local time zone and are from time of writing this report.

Click HERE to access the full HFM Economic calendar.

Want to learn to trade and analyse the markets? Join our webinars and get analysis and trading ideas combined with better understanding of how markets work. Click HERE to register for FREE!

Click HERE to READ more Market news.

Andria Pichidi
HFMarkets


Disclaimer: This material is provided as a general marketing communication for information purposes only and does not constitute an independent investment research. Nothing in this communication contains, or should be considered as containing, an investment advice or an investment recommendation or a solicitation for the purpose of buying or selling of any financial instrument. All information provided is gathered from reputable sources and any information containing an indication of past performance is not a guarantee or reliable indicator of future performance. Users acknowledge that any investment in Leveraged Products is characterized by a certain degree of uncertainty and that any investment of this nature involves a high level of risk for which the users are solely responsible and liable. We assume no liability for any loss arising from any investment made based on the information provided in this communication. This communication must not be reproduced or further distributed without our prior written permission.
HotForex is an award winning, fully regulated and licensed online forex and commodities broker. Offers various accounts, trading software and trading tools to trade Forex and Commodities for individuals, fund managers and institutional customers.
HFblogNews
VideoBourse family
Messages : 2557
Inscription : 26 juin 2014, 12:48

Re: Analyses de Marchés

#908 Message par HFblogNews »

Date: 25th September 2026.

Treasury Yields Ease From 19-Year High as Oil Prices Fall.

Image
Trading Leveraged products is Risky

Stock market today: US stock futures are pointing higher on Friday as Treasury yields pull back from their highest levels in nearly two decades and oil prices cool on hopes for a US–Iran deal. After two days of heavy selling in government bonds, investors are getting a pause. It isn’t a turnaround yet, but it's enough to steady stocks before the opening bell.

10-Year Treasury Yield Pulls Back From 19-Year High

The 10-year Treasury yield slipped to around 5.17% in Asian trading, down from Thursday’s 19-year peak just above 5.22%. The size of the recent move matters more than today’s dip. The 10-year gained roughly 20 basis points in two sessions, its sharpest two-day jump since the tariff shock of April 2025.

Longer-dated bonds did even worse. The 30-year Treasury yield briefly topped 5.50%, a level last seen in 2004. That rise has already reached ordinary households: US mortgage rates are now around 7%, a heavy burden on a housing market that was already struggling.

Global Bond Sell-off Spreads to Japan and Australia

The pressure isn't limited to the US. Japan’s 10-year government bond yield climbed above 3.1%, its highest level since 1996, and Australian 10-year yields moved above 5.4%. Investors worldwide are demanding more compensation to lend over the long-term, driven by both inflation and large government deficits.

Fed Rate Hike Odds Rise to 71% for October

Fed funds futures now put the odds of another US rate hike next month at about 71%, up from roughly even odds earlier this week. Markets are pricing close to four more quarter-point hikes before this cycle ends. The two-year Treasury yield, which tracks near-term Fed expectations, is holding near 4.9%, around a two-year high.

Other central banks are moving in the same direction. Norway’s Norges Bank raised rates on Thursday, and Sweden’s Riksbank signalled it will likely follow by year-end. Mexico’s central bank held steady but dropped its promise of a long pause. That shift has kept the US dollar strong. The US dollar Index is heading for a weekly gain of about 1%, near its highest level since late July.

Oil Prices Today: Brent Falls on US-Iran Truce Hopes

Oil’s pullback is a big reason bonds have calmed. Brent crude fell about 1% to roughly $105.50 a barrel, after rising more than 7% over the previous two sessions. WTI crude dropped more sharply to around $93.

The dip comes from hopes for diplomacy. US and Iranian negotiators in New York are reportedly working on a phased agreement: Tehran would reopen the Strait of Hormuz, and Washington would lift its blockade of Iranian ports. Since the war began in late February, about a fifth of global oil and gas shipments have been disrupted, so any credible path to reopening the strait would matter a great deal.

The risks remain real. Saudi Arabia intercepted six Houthi ballistic missiles aimed at Taif and the Red Sea export hub of Yanbu on Thursday, a reminder that oil infrastructure is still a target.

The Brent-WTI spread is also worth watching. At about $12.70, it's the widest since May. Much of the gap comes from fears that Washington could ban diesel exports, which would leave more fuel in the US market and push domestic prices down relative to global prices.

Asian Markets: Nikkei Rises, Hang Seng Falls After Trump–Xi Talks

With mainland China, South Korea, and Taiwan closed for holidays, trading in Asia was light. Japan’s Nikkei 225 led the region with a gain of about 1%. The yen also firmed to around 158.25 per dollar after Finance Minister Satsuki Katayama said President Trump shares Tokyo's concern about the currency’s weakness.

Hong Kong’s Hang Seng fell about 1% as the Trump-Xi summit continued without concrete deals on AI, trade, Taiwan, or Iran. Australian stocks also slipped as mining shares struggled.

Corporate News: Anthropic, Oracle, Paramount Skydance

* Anthropic signed a seven-year, $11.6 billion computing deal with Akamai Technologies, adding to a long run of large AI infrastructure agreements.
* Oracle is taking steps to limit its cost exposure on a massive data center being built in New Mexico.
* Paramount Skydance is aiming to complete a $52 billion debt sale within the next week to fund its takeover of Warner Bros. Discovery. With yields this high, that financing will be closely watched.

What to Watch Before the US Market Open Today

* The 10-year Treasury yield near 5.2%: If it stays below Thursday's peak, stocks may have room to rebound. A new high would quickly erase today’s calm.
* US-Iran headlines: Signs of real progress on Hormuz would likely push oil prices and yields lower. Another attack on Gulf infrastructure could reverse that quickly.
* Bitcoin options expiry: About $15 billion in Deribit contracts settle today, which could mean volatile trading in crypto.
* Fed speakers: With rate hike odds climbing, any comments from policymakers will move short-term yields.
* Weekly closes: The dollar’s 1% gain and bonds’ worst two days since spring will shape how investors position for next week.

Today looks like a pause, not the end of the bond sell-off. Oil prices remain above $100, central banks are raising rates, and long-term Treasury yields are near their highest in about two decades. Investors should enjoy the calm without assuming it will last. The bond market is still setting the direction for stocks.

Always trade with strict risk management. Your capital is the single most important aspect of your trading business.

Please note that times displayed based on local time zone and are from time of writing this report.

Click HERE to access the full HFM Economic calendar.

Want to learn to trade and analyse the markets? Join our webinars and get analysis and trading ideas combined with better understanding of how markets work. Click HERE to register for FREE!

Click HERE to READ more Market news.

Andria Pichidi
HFMarkets


Disclaimer: This material is provided as a general marketing communication for information purposes only and does not constitute an independent investment research. Nothing in this communication contains, or should be considered as containing, an investment advice or an investment recommendation or a solicitation for the purpose of buying or selling of any financial instrument. All information provided is gathered from reputable sources and any information containing an indication of past performance is not a guarantee or reliable indicator of future performance. Users acknowledge that any investment in Leveraged Products is characterized by a certain degree of uncertainty and that any investment of this nature involves a high level of risk for which the users are solely responsible and liable. We assume no liability for any loss arising from any investment made based on the information provided in this communication. This communication must not be reproduced or further distributed without our prior written permission.
HotForex is an award winning, fully regulated and licensed online forex and commodities broker. Offers various accounts, trading software and trading tools to trade Forex and Commodities for individuals, fund managers and institutional customers.
HFblogNews
VideoBourse family
Messages : 2557
Inscription : 26 juin 2014, 12:48

Re: Analyses de Marchés

#909 Message par HFblogNews »

Date: 30th September 2026.

Gold Rebounds Temporarily? Weaker US Data and Yields Offer Support.

Image
Trading Leveraged products is Risky

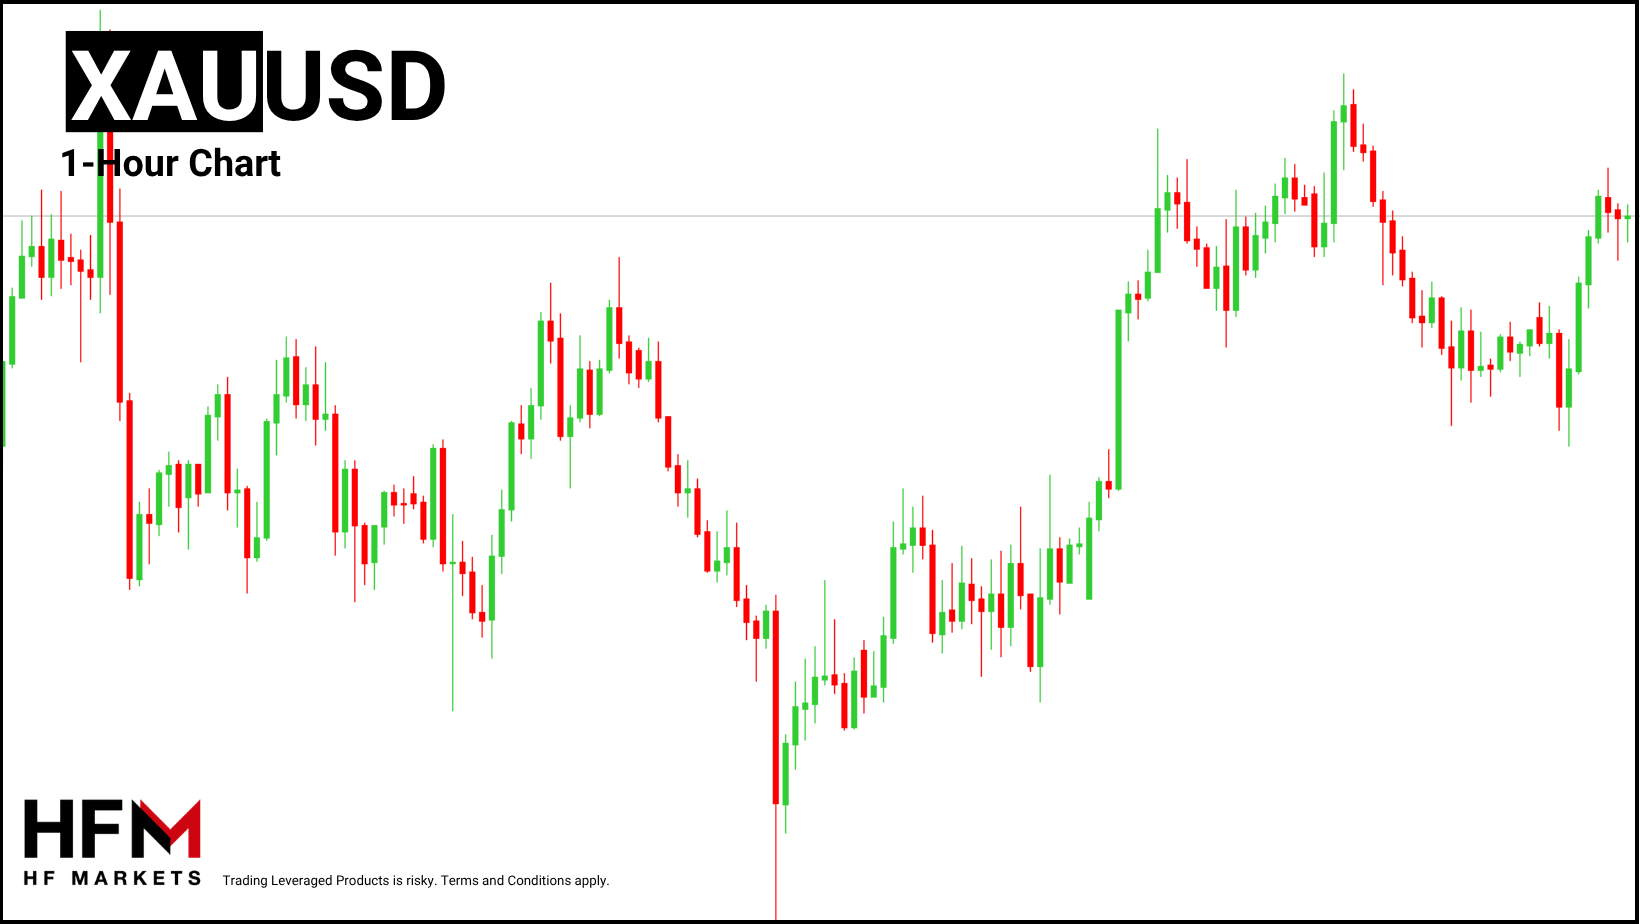
Gold rebounds on Tuesday as the bearish trend takes a pause and investors purchase at the lower price. Gold has now been in a downward-facing trend measuring 12.50% for five weeks. From the highest price in 2026 to now, the price is trading more than 25% lower. The price on Wednesday is trading higher, but what does the future look like for Gold?

Of particular interest was the quick and sudden decline seen on Monday. Gold fell more than 4% throughout all four sessions and with no attempt to rebound. The decline took the price to seven weeks now and close to the psychological price of $4,000. This is also key when analysing the rebound over the past 24 hours, as prices often rebound after such a sharp decline.

Image
HFM - Gold 1-Hour Chart

Gold - Weaker JOLTS Job Openings and Yields Allow A Rebound

In the past 24 hours, gold rose close to 1.90%, which is a moderate rise, but when compared with the previous decline, the rebound remains weak. The attempt to rebound is due to price attractiveness, weaker job vacancies and weaker-than-expected inflation from certain countries.

Australia, which is one of the world’s inflation hotspots, saw its inflation fail to reach previous expectations of 4.1%. The same is also being seen in the UK and Japan. As a result, Gold seems slightly more attractive. The latest JOLTS report showed US job openings falling to around 7.08 million in August 2026, down from roughly 7.3 million in July. This points to softer labour demand. Hiring was broadly stable, quits remained subdued, and layoffs stayed relatively low, suggesting that employers are becoming more cautious about adding workers rather than making large-scale job cuts.

Another reason why Gold is attempting to rebound is the decline in oil prices and bond yields. Oil prices have fallen for three consecutive days, moving away from the $100 per barrel level which investors fear. Crude oil is now trading 14% lower than the most recent high.

Furthermore, the US 10-year Treasury yield fell 33 basis points to 5.23% on Wednesday but remains close to its highest level since 2007. Meanwhile, the 30-year yield rose as high as 5.62%, reaching levels last seen in 2002. The slight fall in bond yields also allows for Gold to retrace higher, but the persistently high levels remain a negative.

Traders should note that the rise currently does not remove all bearish signals, and pressure factors remain for Gold. In the upcoming days, key releases include the Core PCE Price Index, Final Gross Domestic Product and US Non-Farm Payroll data on Friday.

Gold - Economic Release To Drive Upcoming Swings

Markets are expecting the Core PCE Price Index to add a further 0.3% keeping the year on year figure at 3.3%. If the figure rises more than 0.3%, an October rate will almost become certain. However, a 0.4% rise has not been seen since February. If the Core PCE Price Index rises less than the current predictions, Gold may gain bullish momentum. The outcome of the release, along with the final GDP, will be key.

The same will apply to the upcoming Non-Farm Payroll figures scheduled for Friday. A weaker figure may support Gold, while a higher figure is likely to see the bearish trend potentially continue. These three releases are likely to determine the medium-term trend.

Currently, the possibility of an interest rate hike on October 28th is 45%, significantly lower than the 71% the day before. The reason for the fall is the weaker JOLTS Job Openings yesterday afternoon. However, this release is not enough to maintain momentum. In order for gold to continue to rise and rate hike expectations to fall, the NFP and PCE Index will need to fail to reach current expectations.

Gold - Market Forecasts and Technical Analysis

Image
HFM - Gold 15-Minute Chart

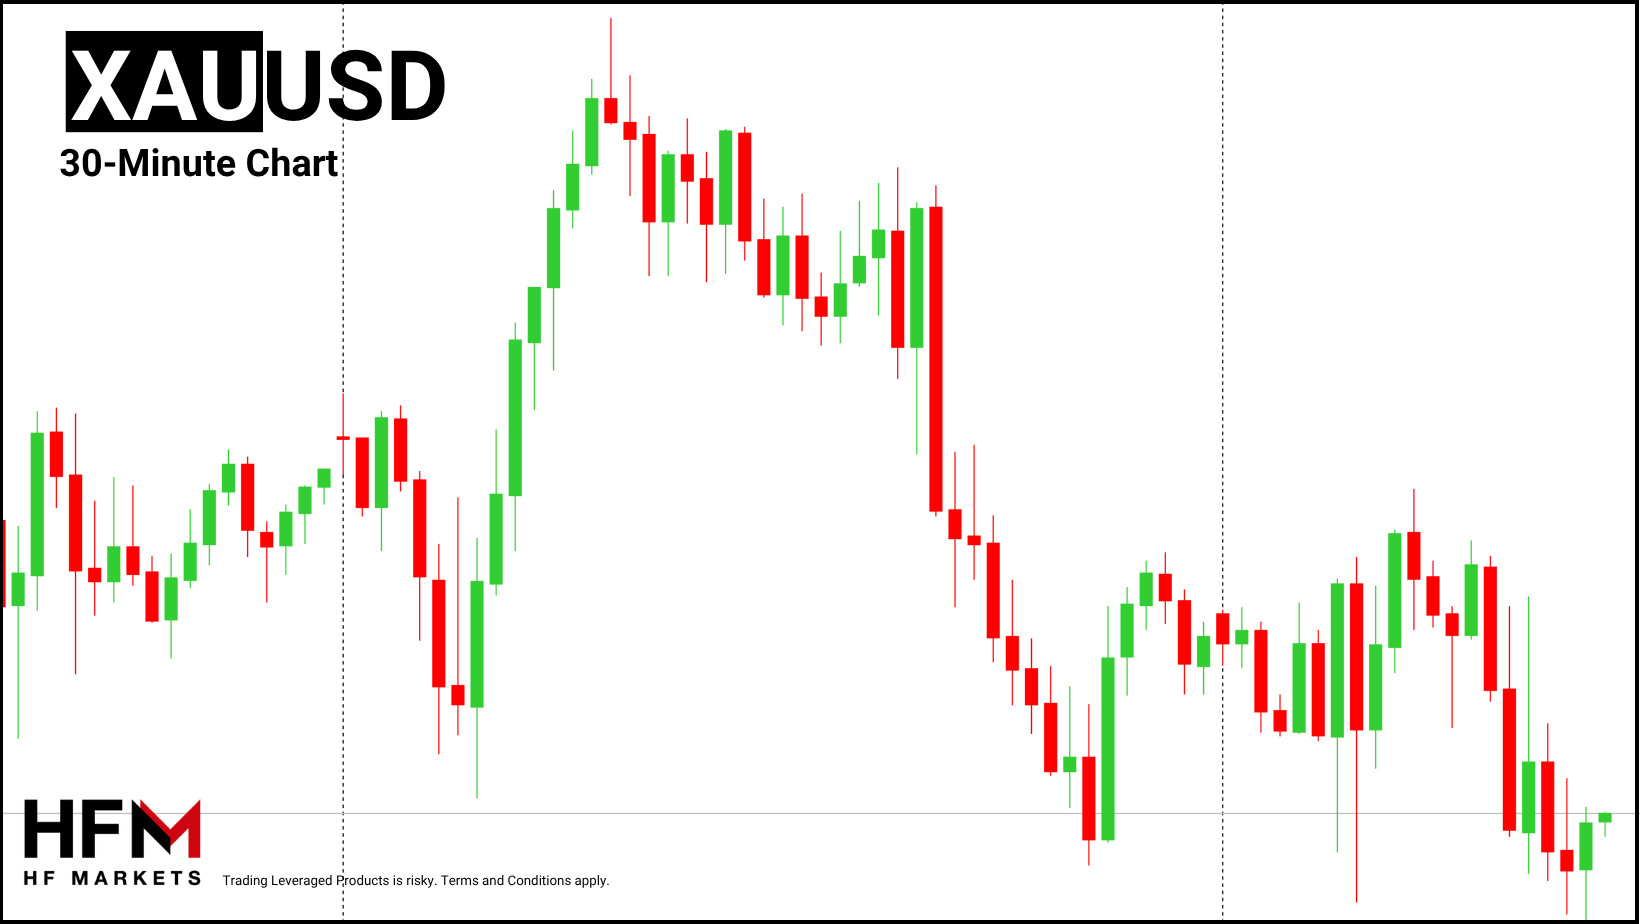
On smaller timeframes, Gold maintains a neutral position and signal from most indications. The neutral sentiment is likely to remain between $4,166.85 and $4,187.60. A breakout of these levels may see indications strengthen. On the 15-minute timeframe, the price maintains a bullish indication while the 30-minute and larger timeframes maintain a bearish signal.

If the price breaks above the upper range bound area, bullish indications can materialise. Potential targets can be seen at the $4,213.60 level (at the 100-bar moving average) and $4,279.18 (Monday’s open price). To validate these indications, traders will ideally want to see weaker US data alongside rising prices across other metals.

A bearish breakout will see bearish sentiment rise and fall in line with the picture seen on larger timeframes. Stronger-than-expected releases will validate the decline with indications pointing towards a decline to $4,111.50 and $4,019.00.

Key Takeaway:

* Gold is rebounding, but the broader trend remains bearish, with prices still sharply lower over the past five weeks.
* Weaker JOLTS data, lower oil prices and softer Treasury yields have helped support the recent recovery.
* Core PCE, US GDP and Non-Farm Payrolls are likely to drive Gold’s next major move and influence Fed rate expectations.
* Technical signals remain mixed, with short-term bullish momentum but larger timeframes still pointing to downside risk.

Always trade with strict risk management. Your capital is the single most important aspect of your trading business.

Please note that times displayed based on local time zone and are from time of writing this report.

Click HERE to access the full HFM Economic calendar.

Want to learn to trade and analyse the markets? Join our webinars and get analysis and trading ideas combined with better understanding of how markets work. Click HERE to register for FREE!

Click HERE to READ more Market news.

Michalis Efthymiou
HFMarkets


Disclaimer: This material is provided as a general marketing communication for information purposes only and does not constitute an independent investment research. Nothing in this communication contains, or should be considered as containing, an investment advice or an investment recommendation or a solicitation for the purpose of buying or selling of any financial instrument. All information provided is gathered from reputable sources and any information containing an indication of past performance is not a guarantee or reliable indicator of future performance. Users acknowledge that any investment in Leveraged Products is characterized by a certain degree of uncertainty and that any investment of this nature involves a high level of risk for which the users are solely responsible and liable. We assume no liability for any loss arising from any investment made based on the information provided in this communication. This communication must not be reproduced or further distributed without our prior written permission.
HotForex is an award winning, fully regulated and licensed online forex and commodities broker. Offers various accounts, trading software and trading tools to trade Forex and Commodities for individuals, fund managers and institutional customers.
HFblogNews
VideoBourse family
Messages : 2557
Inscription : 26 juin 2014, 12:48

Re: Analyses de Marchés

#910 Message par HFblogNews »

Date: October 2, 2026.

Bitcoin Starts Q4 Near Key Resistance as ETF Demand and Fed Expectations Drive the Outlook.


Image

Bitcoin enters the fourth quarter trading close to recent highs, supported by improving institutional demand, stronger spot-market activity and a constructive longer-term technical structure. However, momentum has started to cool on the daily chart, leaving traders focused on whether Bitcoin can break through the next major resistance zone or enter a broader period of consolidation.

With US spot Bitcoin ETF inflows strengthening and several important US economic releases approaching, Bitcoin's next major move could depend as much on developments in traditional financial markets as on crypto-specific factors.

Bitcoin Technical Analysis: Longer-Term Momentum Remains Positive
From a weekly perspective, Bitcoin continues to trade close to the upper Bollinger Band, suggesting that bullish momentum remains present despite the recent slowdown.

The Relative Strength Index remains elevated but has not yet moved beyond the commonly watched 70 level associated with overbought conditions. Meanwhile, the Stochastic oscillator is already trading within overbought territory, making the coming weekly closes important for determining whether buyers can maintain the current momentum.

The MACD also continues to support the broader bullish trend, with its histogram remaining firmly in positive territory.

One particularly important technical development has been Bitcoin's move back above its 365-day moving average. According to CryptoQuant data referenced in the original analysis, this represents the first reclaim of the indicator since March 2023.

Historically, the long-term moving average has attracted attention because sustained moves above it have often coincided with stronger phases of previous Bitcoin market cycles.

However, historical performance does not guarantee that the same pattern will repeat.

Bitcoin Daily Chart Shows Signs of Consolidation
The shorter-term picture is more cautious.

Bitcoin has pulled back from its latest high and is currently moving within a relatively narrow range. This previously suggests that the strong upward momentum seen has started to lose some strength.

Both the RSI and Stochastic indicators are approaching elevated levels, while the MACD histogram has slipped slightly below its zero line. At the same time, the Average Directional Index, or ADX, has started moving lower.

Because the ADX measures the strength of an existing trend rather than its direction, its decline suggests that Bitcoin's latest directional move is becoming less powerful.

This does not necessarily signal a bearish reversal. Instead, it may indicate that the market is entering a period of consolidation while traders reassess valuations and incoming economic data.

Key Bitcoin Support and Resistance Levels
The immediate technical levels could become increasingly important if volatility rises.

On the downside, the first significant support area sits around $83,000, followed by the psychological $80,000 level.

Image


Below this region, approximately $77,000 could also attract attention. This area is close to Bitcoin's aggregate Realized Price cited in the underlying market data, which measures the average acquisition price of Bitcoin currently held across the network.

On the upside, initial resistance can be found near $85,000, followed by approximately $87,000.

A potentially more important support area sits between $88,000 and $90,000. A sustained break above this region could suggest that the market is successfully absorbing the selling pressure created by existing holders.

Beyond this area, approximately $96,000-$97,000 could develop into another major resistance zone.

Bitcoin Levels to Watch

* Support: $83,000
* Major psychological support: $80,000
* Secondary support: approximately $77,000
* Initial resistance: $85,000
* Secondary resistance: $87,000
* Major support zone: $88,000-$90,000
* Higher resistance: approximately $96,000-$97,000

Bitcoin ETF Inflows Strengthen Institutional Demand
One of the most supportive developments for Bitcoin has been the recovery in US spot Bitcoin ETF demand.

US-listed spot Bitcoin ETFs recorded approximately $2.39 billion in weekly net inflows, their strongest weekly performance of 2026 according to the data cited in the original report.

The significance lies not only in the size of the inflows but also in when they occurred.

Demand remained relatively strong even as Bitcoin pulled back from above $87,000 towards the $83,000 area. This may indicate that institutional investors were willing to increase exposure during weaker price action rather than simply entering after strong rallies.

The ETF market has also experienced a substantial improvement compared with earlier in the year. After recording a multi-billion-dollar year-to-date deficit during the summer, cumulative flows reportedly returned to positive territory.

Spot-market trading volumes have also increased considerably compared with their August lows, providing another sign that participation is recovering.

Continued ETF inflows could therefore remain one of the most important fundamental factors supporting Bitcoin during Q4.

Options Market Points to Higher Resistance Levels
Bitcoin derivatives markets are also providing useful information about investor positioning.

Options activity has maintained a relatively bullish bias, with the put-to-call ratio remaining below 1 during the period covered by the report.

Call options give traders the right to buy an asset at a predetermined price, while puts provide the right to sell. A lower put-to-call ratio can therefore indicate stronger demand for upside exposure, although options positioning should never be interpreted in isolation.

Large positioning has also appeared around substantially higher Bitcoin strike prices for December expiry.

Dealer hedging activity reportedly highlights the $95,000-$97,000 region as one of the first major resistance areas should Bitcoin extend its recovery.

Bitcoin Remains Highly Sensitive to NASDAQ and Global Risk Sentiment
Despite developments specific to the cryptocurrency market, Bitcoin continues to trade as part of the wider global risk environment.

Recent price action demonstrated this relationship when Bitcoin, gold and the Nasdaq all declined during the same period.

Bitcoin fell from around $84,500 towards $82,800, while US technology stocks and gold also came under pressure.

Interestingly, the US Dollar Index also weakened during the move.

That combination differs from a traditional flight-to-safety environment, in which investors would normally expect the dollar to strengthen. Instead, the simultaneous decline across several asset classes could point towards broader position reduction or deleveraging.

For Bitcoin traders, this reinforces the importance of monitoring equity markets, Treasury yields and overall investor risk appetite rather than focusing exclusively on cryptocurrency developments.

Federal Reserve Expectations Could Be Crucial for Bitcoin
The Federal Reserve remains another major risk factor heading into the remainder of Q4.

Two FOMC meetings remain during the quarter: October 27-28 and December 8-9.

At the beginning of the period covered by the source material, financial markets were pricing a higher probability of another 25-basis-point increase in October than of unchanged interest rates.

However, these probabilities can change rapidly following inflation, employment and economic-growth releases. Higher interest rates generally increase yields available on lower-risk assets while tightening financial conditions. This can create pressure on assets such as cryptocurrencies and growth stocks. Conversely, softer inflation or weaker economic data could reduce expectations for additional tightening, potentially improving sentiment towards risk assets.

This means incoming US economic releases could become just as important for Bitcoin as crypto-specific news.

US Inflation and Labour Data Come Into Focus
Several important economic indicators could influence the Federal Reserve's next decision.

Core PCE inflation remains particularly significant because it is one of the Fed's preferred measures of underlying inflation. A stronger-than-expected inflation reading could reinforce expectations that interest rates need to remain restrictive for longer. A weaker result, by contrast, could reduce pressure on policymakers to tighten monetary policy further.

US economic growth is another factor traders will monitor closely. Strong GDP growth can demonstrate economic resilience, but it can also provide the Federal Reserve with greater flexibility to maintain higher interest rates.

Labour-market data will also remain important tomorrow with NFP.

If employment remains strong and unemployment stays low, policymakers may see less urgency to loosen financial conditions. Conversely, signs of material labour-market weakness could shift expectations towards a more cautious Fed stance.

Bitcoin's reaction to upcoming macroeconomic releases may therefore depend heavily on how those figures change expectations for interest rates.

Q4 Has Historically Been Strong for Bitcoin – But History Is Not a Guarantee
The fourth quarter has historically produced some of Bitcoin's strongest returns. Bitcoin's average Q4 performance since 2013 has been particularly strong compared with other periods of the year. However, averages can be misleading.

Bitcoin has also recorded weaker fourth quarters, and the structure of the cryptocurrency market has changed considerably over time. Institutional participation is significantly larger, spot ETFs have become an important source of market demand and Bitcoin is increasingly influenced by global liquidity conditions and monetary policy.

Another important consideration is the gradual reduction in returns across Bitcoin's major historical cycles.

Each successive cycle has produced a smaller multiple from its market low than the previous cycle. This trend could suggest that as Bitcoin matures into a larger asset class, investors may need to moderate expectations regarding the scale of future gains.

Crypto Adoption Continues Despite Market Volatility
While cryptocurrency prices have experienced considerable volatility, blockchain activity has remained relatively resilient.

According to Chainalysis data cited in the source material, worldwide crypto activity declined only slightly over the year through June, despite a much larger fall in total cryptocurrency market capitalisation. A notable part of that activity came from areas outside speculative trading. Domestic peer-to-peer transactions expanded significantly, while international stablecoin transfers also increased.

Stablecoin balances remained comparatively stable even as broader crypto asset values declined sharply, suggesting that blockchain-based payment and settlement activity may be developing independently from short-term market valuations.

This distinction could become increasingly important as investors evaluate whether cryptocurrency adoption is being driven primarily by speculation or by growing financial utility.

Tokenization Becomes a Larger Traditional Finance Theme
Another longer-term development is the increasing interest in tokenized financial markets.

US regulators have recently discussed the potential expansion of tokenized assets, on-chain financial infrastructure and round-the-clock trading.

The CFTC has highlighted the possibility that financial markets could experience significant structural changes over the next decade as blockchain technology becomes more integrated into traditional finance.

Regulatory developments around stablecoins, tokenized securities and 24-hour markets could therefore become an increasingly important theme for both cryptocurrency and traditional financial markets.

Bitcoin Q4 Outlook: What Could Drive the Next Move?
Bitcoin begins Q4 with several constructive factors behind it.

Institutional ETF demand has strengthened, spot-market activity has recovered and Bitcoin's broader technical structure remains positive.

However, the market is also approaching important resistance areas while short-term momentum indicators show signs of cooling.

A stronger bullish scenario could develop if ETF inflows remain persistent and Bitcoin successfully breaks above the $88,000-$90,000 resistance region .

A move beyond this supply zone could shift attention towards approximately $ 95,000-$97,000 .

The downside scenario would become more relevant if inflation remains elevated, Federal Reserve expectations turn increasingly hawkish or investors begin taking substantially larger profits into price strength.

For now, the $83,000-$85,000 region may act as an important short-term battleground between buyers and sellers.

Whether Bitcoin can defend its recent gains while absorbing overhead supply could determine if the cryptocurrency extends its recovery during Q4 or enters a broader consolidation phase.

Always trade with strict risk management. Your capital is the single most important aspect of your trading business.

Please note that times displayed based on local time zone and are from time of writing this report.


Click HERE to access the full HFM Economic calendar.

Want to learn to trade and analyze the markets? Join our webinars and get analysis and trading ideas combined with better understanding of how markets work. Click HERE to register for FREE!

Click HERE to READ more Market news.

Andria Pichidi
HFMarkets

Disclaimer:
This material is provided as a general marketing communication for information purposes only and does not constitute an independent investment research. Nothing in this communication contains, or should be considered as containing, an investment advice or an investment recommendation or a solicitation for the purpose of buying or selling of any financial instrument. All information provided is gathered from reputable sources and any information containing an indication of past performance is not a guarantee or reliable indicator of future performance. Users acknowledge that any investment in Leveraged Products is characterized by a certain degree of uncertainty and that any investment of this nature involves a high level of risk for which the users are solely responsible and liable. We assume no liability for any loss arising from any investment made based on the information provided in this communication. This communication must not be reproduced or further distributed without our prior written permission.
HotForex is an award winning, fully regulated and licensed online forex and commodities broker. Offers various accounts, trading software and trading tools to trade Forex and Commodities for individuals, fund managers and institutional customers.
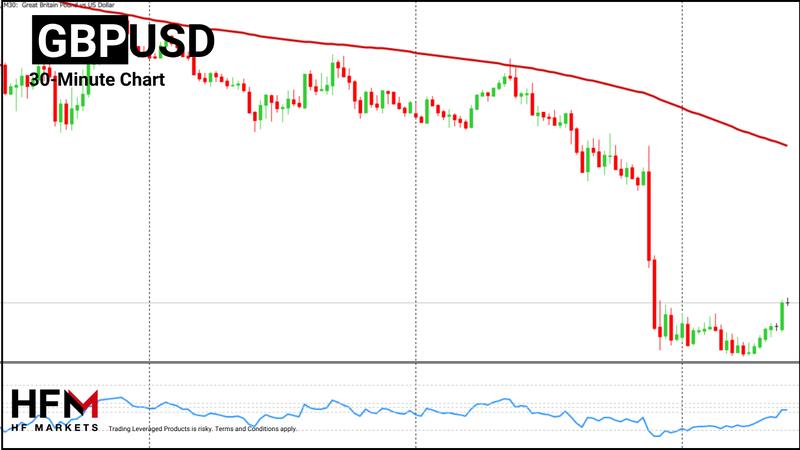
HFblogNews
VideoBourse family
Messages : 2557
Inscription : 26 juin 2014, 12:48

Re: Analyses de Marchés

#911 Message par HFblogNews »

Date: 9th October 2026.

Gold and S&P 500 Rebound: Can the Rally Continue?

Image
Trading Leveraged products is Risky

The market risk appetite is improving on Friday as President Trump indicates that the US will not strike Iran before the midterms. The US blockade of the Strait of Hormuz will remain intact but the US military is likely to remain inactive unless serious threats arise. Political experts say the White House will look to lower oil prices as the US midterms approach. This would be three weeks of possible calm in the Middle East.

As a result, oil prices, along with bond yields, are falling slightly, allowing for ‘risk-on’ market conditions. The best-performing assets of the day are currently metals and the stock market. In addition, a key factor is earnings season, which is only a few days away.

Earnings Season - OpenAI Eyes $70 Billion in Revenue by Year End

The quarter’s earnings season will start on Tuesday 13 October, with major US banks and the healthcare sector announcing their reports. On Tuesday, JPMorgan, Goldman Sachs, Johnson & Johnson, and UnitedHealth Group will make their third-quarter reports public. The release will mainly impact the S&P 500 and Dow Jones, but could also affect other stocks.

The S&P 500 and Dow Jones are more exposed to these sectors, but the results can impact investor sentiment in general. As a result, all global indices could experience volatility and new trends. The technology sector will start releasing quarterly earnings reports on October 21 October with Tesla and Lam Research Corporation.

The three main US indices, the NASDAQ, S&P 500, and Dow Jones have struggled in the past two days, but are quickly rebounding as earnings expectations boost demand. Of particular interest are OpenAI’s latest statements regarding its revenue expectations.

OpenAI expects its annualised revenue to reach or exceed $70 billion this year, compared with approximately $50 billion at the end of September. The change represents a potential 40% increase. This growth is expected to be driven primarily by rising demand for its enterprise AI services as businesses increasingly adopt artificial intelligence.

The company is also reportedly seeking to raise $30 billion in new funding at a valuation of $1.4 trillion. The announcement follows concerns over OpenAI’s revenue figures, which contributed to selling pressure across technology and AI-related stocks. Despite these concerns, the latest projections highlight the rapid expansion of the AI industry and its growing importance to investor sentiment.

S&P 500 Rebounds As Earnings Edge Closer

The S&P 500 is trading close to 0.30% higher during this morning’s Asian session, but is still forming lower lows and lower highs. For this reason, investors will be cautious about the index’s direction and market signals. Currently, all indices are trading higher with the Nikkei 225 and NASDAQ seeing the strongest gains, while the Dow Jones is recording the weakest increase. The fact that gains can be seen across all global indices remains a positive indication.

The VIX Index is trading 1.30% lower, while index components are trading higher in pre-market trading. These factors indicate a possible rebound, however, the put-call ratio and McClellan Volume Summation Index are indicating weakness in market demand. For this reason, the short-term indications remain positive, but medium-term risks remain. The medium-term outlook will also largely depend on earnings reports. If earnings fail to impress, the index could fall, particularly as its trading very close to all-time highs.

Image
HFM - S&P 500 15-Minutes Charts

In the 5-minute timeframe, the price is trading above the VWAP and the moving average. This is providing a bullish indication, however, if the price falls below $7,781.50, these signals will fade.

Gold Rebounds, but Will It Be Limited?

Gold is seeing a strong rebound after declining on Wednesday to the lowest price since 4 August. Slightly lower bond yields and weaker US Dollar are allowing Gold to rise. However, investors should note that both the Dollar and bond yields remain extremely high, which may limit the bullish trend unless market conditions change.

According to the September FOMC minutes published yesterday, all 19 Fed policymakers supported an interest rate increase, with over 60% anticipating another hike this year. The probability of a year-end hike reached 69.3%, its highest level this year. The likelihood of rates remaining unchanged in October stands at 81.2%. However, most economists believe nothing has changed in the longer-term interest-rate outlook.

As the price rose 2% on Friday, Gold is now trading at a key resistance level. However, as Gold rises, the US Dollar Index is not continuing to fall. If the US Dollar Index remains above 101.80, Gold may struggle to continue the current trend.

Image
HFM - Gold 15-Minute Chart

Key Takeaways:

* Reduced geopolitical tensions in the Middle East, alongside lower oil prices and bond yields, are supporting risk appetite.
* Major US banks and healthcare companies begin reporting on 13 October, with results expected to influence broader market sentiment.
* Global indices are recovering, supported by earnings expectations and OpenAI’s projected $70 billion annualised revenue. However, medium-term risks remain.
* Gold is rising 2% as bond yields and the US Dollar weaken. However, expectations of another Fed rate hike and key technical resistance could limit further gains.

Always trade with strict risk management. Your capital is the single most important aspect of your trading business.

Please note that times displayed based on local time zone and are from time of writing this report.

Click HERE to access the full HFM Economic calendar.

Want to learn to trade and analyse the markets? Join our webinars and get analysis and trading ideas combined with better understanding of how markets work. Click HERE to register for FREE!

Click HERE to READ more Market news.

Michalis Efthymiou
HFMarkets


Disclaimer: This material is provided as a general marketing communication for information purposes only and does not constitute an independent investment research. Nothing in this communication contains, or should be considered as containing, an investment advice or an investment recommendation or a solicitation for the purpose of buying or selling of any financial instrument. All information provided is gathered from reputable sources and any information containing an indication of past performance is not a guarantee or reliable indicator of future performance. Users acknowledge that any investment in Leveraged Products is characterized by a certain degree of uncertainty and that any investment of this nature involves a high level of risk for which the users are solely responsible and liable. We assume no liability for any loss arising from any investment made based on the information provided in this communication. This communication must not be reproduced or further distributed without our prior written permission.
HotForex is an award winning, fully regulated and licensed online forex and commodities broker. Offers various accounts, trading software and trading tools to trade Forex and Commodities for individuals, fund managers and institutional customers.
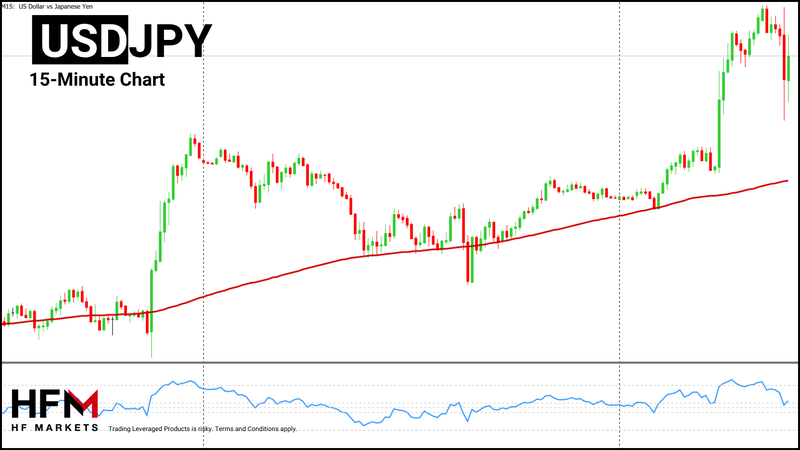
HFblogNews
VideoBourse family
Messages : 2557
Inscription : 26 juin 2014, 12:48

Re: Analyses de Marchés

#912 Message par HFblogNews »

Date: 12th October 2026.

Dow Jones & Gold: What’s Driving the Rebound.

Image
Trading Leveraged products is Risky

Gold and the stock market are declining after originally increasing during this week’s market open. The u-turn comes as the US Dollar and Oil prices rebound. The recent key drivers are Russia and Ukraine’s energy ceasefire and also the tensions between Yemen and Saudi Arabia. However, markets expect more volatility and greater clarity following the release of US consumer and producer inflation data later this week.

This week will also see the start of earnings season, with major US banks making their earnings reports public. So far, the Dow Jones is the best-performing US index, while the NASDAQ is witnessing the strongest decline.

Dow Jones - Earnings & Inflation

The Dow Jones rose 0.35% during this morning’s opening hours, rising to its highest level since 25 September. The upward price movement potentially may have been due to the better market conditions, including the weaker Dollar, lower oil prices, and the decline amongst bond yields. Investors may have also been continuing last week’s trend as the market gets ready for this week’s earnings data.

However, as the European open edges closer, the positive market conditions are fading. The US Dollar’s decline has come to a halt, and oil prices have risen 2%. For this reason, markets are becoming cautious, but the VIX index remains 1% lower, maintaining a ‘risk-on’ sentiment.

The main market pressures are currently coming from high bond yields and the Middle East. The geopolitical tensions in the Persian Gulf and the risk of Houthi disruptions to the Bab-el-Mandeb Strait, a key oil shipping route, remain in the spotlight. Meanwhile, easing Fed hawkishness, stabilising inflation, and signs of economic cooling weigh on prices. Currently, 82.8% of the market believes rates will remain unchanged in October. This is likely to remain the case unless inflation rises higher than the current expectations.

For this reason, this week’s events will be vital in determining how the index will move in the upcoming days. Markets expect the US inflation rate to rise from 3.4% to 3.6%. If the inflation rate rises above this level, the Dow Jones can come under pressure, particularly if oil prices also remain above $90. However, if inflation does not rise to 3.6%, the Dow Jones may continue to rebound higher. The possible rebound will be particularly strong if supported by positive earnings data.

Image

Goldman Sachs Earnings Report

The Dow Jones will be strongly influenced by the earnings reports of Goldman Sachs, UnitedHealth, Johnson & Johnson and JPMorgan. However, the strongest driver will be the earnings report from Goldman Sachs. Currently, Goldman Sachs stock is the most influential for the index as it holds a weight of more than 10%. This year, the stock has risen almost 6%.

Analysts expect earnings per share of approximately $12.90 and revenue of $16.87 billion, representing an estimated 11.1% annual revenue increase. The bank is expected to benefit from stronger investment banking activity, particularly mergers and acquisitions, corporate advisory services, and underwriting. However, trading revenues could face seasonal pressure following an exceptionally strong second quarter, while rising operating expenses may weigh on profitability.

The fundamental outlook for Goldman Sachs remains cautiously positive, supported by continued demand for investment banking services and corporate transactions. The bank has exceeded earnings expectations for four consecutive quarters, increasing expectations for another positive surprise. However, tomorrow's market reaction will depend not only on whether earnings exceed forecasts but also on trading performance, cost management, and management's outlook for Q4.

If Goldman Sachs shares increase in value after tomorrow’s earnings release, the Dow Jones can also find major support. However, the upward price movement will also depend on the US Consumer Price Index as well as the less important earnings reports.

Will Gold’s Rebound Continue?

Gold, which has been struggling since late August, rose in value at the end of last week, taking the price to a key resistance level. The increase was partly driven by investors taking advantage of lower prices following Wednesday’s sharp decline. Additionally, expectations that the Federal Reserve will keep interest rates unchanged in October provided further support. So far this morning, the price has seen an impulse wave in both directions.

In the medium term, the Consumer Price Index and Producer Price Index will help determine Gold's price action. Whereas, in the short term (Monday alone), markets will continue to monitor developments in the Middle East, bond yields, oil prices, and the US Dollar. If the US Dollar Index remains above 102.00 and bond yields record a daily gain, Gold will struggle to maintain bullish momentum. In the medium term, higher inflation rates could result in an October rate hike and potentially weaken Gold prices.

Image

Key Takeaways:

* Russia-Ukraine Ceasefire: Prospects of a ceasefire remain a key factor influencing global market sentiment.
* Corporate Earnings: Upcoming earnings reports could drive stock market volatility and influence investor confidence.
* Fed & Inflation: Stabilising inflation strengthens expectations that the Federal Reserve will keep interest rates unchanged in October.
* Middle East Tensions: Escalating geopolitical tensions raise concerns over oil supply disruptions and increased market uncertainty.

Always trade with strict risk management. Your capital is the single most important aspect of your trading business.

Please note that times displayed based on local time zone and are from time of writing this report.

Click HERE to access the full HFM Economic calendar.

Want to learn to trade and analyse the markets? Join our webinars and get analysis and trading ideas combined with better understanding of how markets work. Click HERE to register for FREE!

Click HERE to READ more Market news.

Michalis Efthymiou
HFMarkets


Disclaimer: This material is provided as a general marketing communication for information purposes only and does not constitute an independent investment research. Nothing in this communication contains, or should be considered as containing, an investment advice or an investment recommendation or a solicitation for the purpose of buying or selling of any financial instrument. All information provided is gathered from reputable sources and any information containing an indication of past performance is not a guarantee or reliable indicator of future performance. Users acknowledge that any investment in Leveraged Products is characterized by a certain degree of uncertainty and that any investment of this nature involves a high level of risk for which the users are solely responsible and liable. We assume no liability for any loss arising from any investment made based on the information provided in this communication. This communication must not be reproduced or further distributed without our prior written permission.
HotForex is an award winning, fully regulated and licensed online forex and commodities broker. Offers various accounts, trading software and trading tools to trade Forex and Commodities for individuals, fund managers and institutional customers.
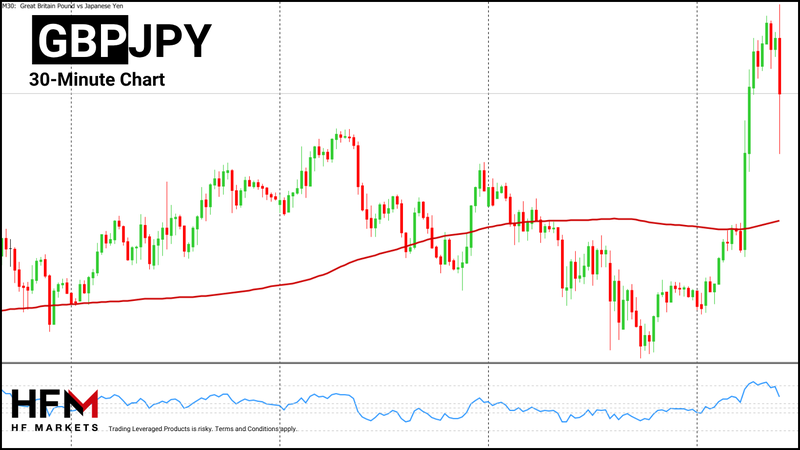
HFblogNews
VideoBourse family
Messages : 2557
Inscription : 26 juin 2014, 12:48

Re: Analyses de Marchés

#913 Message par HFblogNews »

Date: 13th October 2026.

High Volatility Ahead of US Inflation as IMF Warns of Global Risks.

Image
Trading Leveraged products is Risky

The US Dollar Index is falling during Tuesday’s Asian session after rising to the highest level in six months. The decline is due to falling bond yields and markets pausing ahead of the release of the US inflation rate. The US Dollar Index has been increasing in value for almost five consecutive weeks. Investors are warning that the quick rise is prompting slightly overstretched indications unless tomorrow's inflation reads higher.

Volatility in bonds, gold, currencies, and indices are also being driven by the latest statements from Broadcom and the IMF. Broadcom, the eighth most influential company in the NASDAQ and a key player in AI, has raised concerns about growing speculation in the sector. Its CEO warned that AI investing is becoming ‘casino-like’, with many investors lacking understanding and holding unrealistic expectations.

As a result, the NASDAQ and S&P 500 are declining in value, while the Dow Jones is experiencing a strong gain. This is due to the Dow Jones’s exposure to defensive stocks and the banking sector. The banking sector is due to announce their earnings reports before the market opens on Tuesday.

USD/CAD - The Dollar Loses Momentum as Investors Turn to Bonds

The US Dollar Index is experiencing strong gains due to expectations of higher interest rates for a prolonged period. In addition, the currency is also experiencing demand due to high bond yields and its safe-haven status. At the same time, the Canadian dollar continues to come under pressure from US trade demands, weak economic growth, and political uncertainty.

A key factor that is impacting safe-haven assets is the latest IMF statement. The IMF’s statement on 13 October felt more like a warning rather than a neutral statement. According to the statement, the global economy is becoming increasingly vulnerable to further shocks, particularly as government bond yields rise and public debt remains elevated. The statement also made reference to the rising energy prices and possible AI-related market risks.

As a result, many safe-haven assets are increasing in value. These include, Gold, bonds, the Japanese Yen and the Swiss Franc. The US Dollar on the other hand, saw a small decline due to higher bond demand and the upcoming inflation report. Many investors will wait to see what the latest inflation figure will indicate for monetary policy.

Market analysts expect inflation to rise from 3.4% to 3.6%. If the inflation figure comes in higher, the US Dollar could again see an increase. However, a lower figure or a reading line with expectations may see the daily fall continue into a correction. Without a considerable rise in inflation, the Federal Reserve is likely to pause in October.

USDCAD - Technical Analysis

Image

In terms of technical analysis, on the daily timeframe, indications remain bullish, but the picture seems overstretched at such a high price. The USD/CAD has risen for six consecutive weeks, but has been struggling to rise further over the past week. Nonetheless, the shorter-term timeframes are not indicating a downward trend, and downward retracements are losing momentum. At the same time, on the short- and medium-term charts, the price continues to trade above the key moving averages.

Gold Rebounds, but Inflation Remains Key

Gold prices saw a strong rise this morning after declining on Monday. The key drivers were the decline in bond yields for a second consecutive day, ‘risk off’ appetite, and a slight decline in the Dollar. However, traders should note that the US Dollar Index remains elevated and above 102.00. While the short-term price action remains above 102.00, gold may struggle to maintain bullish momentum.

At the same time, Gold will also be influenced by the upcoming US inflation reading. If the inflation reading is higher than expected, Gold may decline in the short term. However, a decline or slight rise will likely benefit Gold as the Fed may opt to keep rates unchanged for the rest of the year.

The price of Gold was trading 0.64% higher this morning but is retracing lower as the European session nears. If the price rises above $4,194.40, bullish indications will likely remain intact. If the price falls below $4,181.00, buy signals will be erased until bullish momentum is seen again.

Image
HFM - Gold 1-Hour Chart

Key Takeaways:

* The Dollar retreats from a six-month high as bond yields decline and investors await US inflation data.
* The IMF warns of growing economic vulnerabilities, while Broadcom raises concerns about excessive AI speculation.
* The USD/CAD remains bullish but shows signs of overextension, with upcoming inflation data likely to influence its next move.
* Gold benefits from declining bond yields and safe-haven demand, with $4,194.40 acting as key resistance and $4,181.00 as support.

Always trade with strict risk management. Your capital is the single most important aspect of your trading business.

Please note that times displayed based on local time zone and are from time of writing this report.

Click HERE to access the full HFM Economic calendar.

Want to learn to trade and analyse the markets? Join our webinars and get analysis and trading ideas combined with better understanding of how markets work. Click HERE to register for FREE!

Click HERE to READ more Market news.

Michalis Efthymiou
HFMarkets


Disclaimer: This material is provided as a general marketing communication for information purposes only and does not constitute an independent investment research. Nothing in this communication contains, or should be considered as containing, an investment advice or an investment recommendation or a solicitation for the purpose of buying or selling of any financial instrument. All information provided is gathered from reputable sources and any information containing an indication of past performance is not a guarantee or reliable indicator of future performance. Users acknowledge that any investment in Leveraged Products is characterized by a certain degree of uncertainty and that any investment of this nature involves a high level of risk for which the users are solely responsible and liable. We assume no liability for any loss arising from any investment made based on the information provided in this communication. This communication must not be reproduced or further distributed without our prior written permission.
HotForex is an award winning, fully regulated and licensed online forex and commodities broker. Offers various accounts, trading software and trading tools to trade Forex and Commodities for individuals, fund managers and institutional customers.
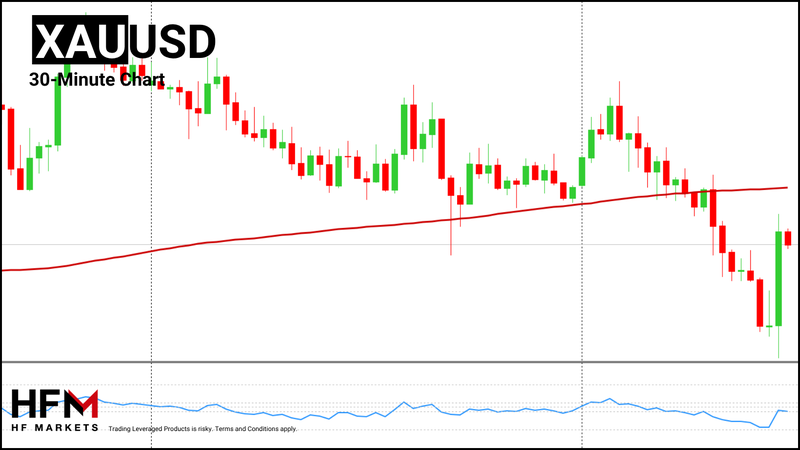
HFblogNews
VideoBourse family
Messages : 2557
Inscription : 26 juin 2014, 12:48

Re: Analyses de Marchés

#914 Message par HFblogNews »

Date: 14th October 2026.

US Inflation in Focus: Gold, Oil, and S&P 500 Brace for Volatility.

Image
Trading Leveraged products is Risky

US bond yields continue to decline for a fifth consecutive day, easing pressure on stocks and gold. Though investors continue to remain cautious before the releasing of today’s Consumer Price Index. As a result, Gold and the stock market continue to struggle to maintain bullish momentum and impulse waves.

A factor that is dampening market sentiment are the higher oil prices. Oil prices, along with the inflation reading, will play a key role in determining how prices move throughout the rest of the week.

Brent Oil Prices Remain Stubbornly High

The price of Brent oil is declining this morning but remains above yesterday’s price range. The issue for the economy is that oil prices have remained above $100.00 for an extended period as tensions in the Gulf region continue to rise. The last time the price was below $100 per barrel was on 23 September.

The conflict with the Yemeni Houthis is causing travel disruptions in Saudi Arabia. Major airlines, including Etihad Airways and Qatar Airways, have cancelled or suspended flights to the country.

At the same time, concerns about energy supply disruptions are making transportation more expensive. Shipping and insurance costs have increased significantly, adding further pressure to global energy markets.

Rising tensions in the Middle East can affect oil supplies and transportation costs, potentially pushing oil prices higher and increasing market volatility. However, this will depend on geopolitics. If the US inflation rate reads higher than expectations and oil prices rise throughout the day, the market could quickly see ‘risk-off’ sentiment. However, if prices continue to retrace lower and inflation fails to rise above expectations, market sentiment could improve. Key levels for market sentiment include $110 per barrel and $105.

Gold Falls Despite Lower Bond Yields

Despite the cooling bond yields, Gold continues to struggle to maintain bullish momentum. The downward price movement is largely driven by a lack of demand before the inflation release. The US will release its inflation data for September this afternoon at 12:30 GMT. Investors are awaiting this confirmation before determining how to trade and change their portfolios.

In addition to the inflation reading, investors are also paying attention to the IMF’s comments, oil prices, and the Federal Reserve.

The IMF issued a statement providing a stark warning about the risk of a global economic recession. The IMF warned that US economic growth alone will not be enough to reduce the country's rising national debt and budget deficit. It called for additional measures to improve government finances.

When the economy and employment remain resilient and in growth mode the US Dollar and bonds are more attractive for investors while inflation and bond yields are high, particularly as the Federal Reserve keeps hiking. However, if a recession is imminent, the mood can change and boost demand for Gold. particularly if the Federal Reserve is no longer able to hike interest rates.

Image
HFM - Gold 30-Minute Chart

In the short term, a higher inflation rate will pressure Gold, while a weaker reading will support Gold. Currently, technical analysis is providing a bearish bias as the price falls and remains below moving averages.

S&P 500 - The Fed's John Williams Indicate A Prolonged Pause in 2027

The S&P 500 on Tuesday was both up and down in price movement, as it is this morning. Currently, all global indices are trading slightly higher, and the VIX Index is trading lower. This provides a slight bullish bias. However, the price movement is almost entirely dependent on the upcoming inflation release. For this reason, investors should be cautious.

Federal Reserve Bank of New York President John Williams said he still sees one more interest rate hike as appropriate this year. This interest rate hike is already almost entirely priced into the market. For this reason, a hike will have a minor impact. The key factor will be whether the Fed is going to continue hiking in 2027.

Williams said there are still signs inflation will slow and approach the Fed’s 2% target next year, as the impact from tariffs and an energy price shock fades. He also stated that a hike will not be necessary in 2027 if the Fed hikes in December. This could be a positive factor, but only if inflation indeed falls.

Image
HFM - S&P 500 1-Hour Chart

Key Takeaways:

* US Inflation in Focus: September’s CPI release at 12:30 GMT could drive volatility across Gold, Oil and global stock markets.
* Brent Oil Above $100: Rising Middle East tensions and higher transportation costs continue to fuel inflation concerns, with $105 and $110 as key price levels.
* Gold Struggles Despite Falling Yields: US bond yields decline for a fifth consecutive day, but Gold remains under pressure as investors await inflation data. A higher-than-expected reading could add further downside pressure.
* S&P 500 Awaits Direction: US indices show a slight bullish bias, supported by falling bond yields and a lower VIX. However, inflation data and expectations for future Federal Reserve rate hikes remain the main drivers.

Always trade with strict risk management. Your capital is the single most important aspect of your trading business.

Please note that times displayed based on local time zone and are from time of writing this report.

Click HERE to access the full HFM Economic calendar.

Want to learn to trade and analyse the markets? Join our webinars and get analysis and trading ideas combined with better understanding of how markets work. Click HERE to register for FREE!

Click HERE to READ more Market news.

Michalis Efthymiou
HFMarkets


Disclaimer: This material is provided as a general marketing communication for information purposes only and does not constitute an independent investment research. Nothing in this communication contains, or should be considered as containing, an investment advice or an investment recommendation or a solicitation for the purpose of buying or selling of any financial instrument. All information provided is gathered from reputable sources and any information containing an indication of past performance is not a guarantee or reliable indicator of future performance. Users acknowledge that any investment in Leveraged Products is characterized by a certain degree of uncertainty and that any investment of this nature involves a high level of risk for which the users are solely responsible and liable. We assume no liability for any loss arising from any investment made based on the information provided in this communication. This communication must not be reproduced or further distributed without our prior written permission.
HotForex is an award winning, fully regulated and licensed online forex and commodities broker. Offers various accounts, trading software and trading tools to trade Forex and Commodities for individuals, fund managers and institutional customers.
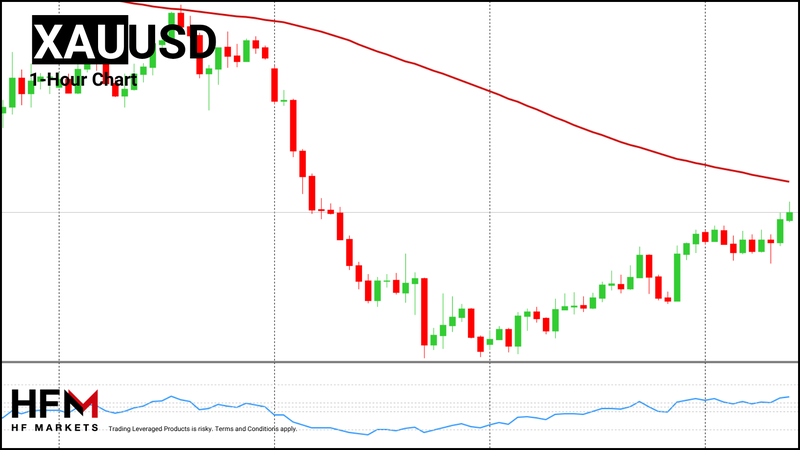
HFblogNews
VideoBourse family
Messages : 2557
Inscription : 26 juin 2014, 12:48

Re: Analyses de Marchés

#915 Message par HFblogNews »

Date: 15th October 2026.

CPI Shock Triggers ‘Risk-Off’ Sentiment: What It Means for Gold and the NASDAQ.

Image
Trading Leveraged products is Risky

The US inflation rate, as well as core inflation data, reads higher than analysts' previous expectations. The US inflation rose from 3.4% to 3.7%, while core inflation rose to 2.6%. Both inflation readings are 0.1% higher than previous expectations, indicating that the Federal Reserve will almost certainly hike before year-end.

The reading was quick to trigger volatility and strong order flow as markets reacted. One of the most volatile assets was Gold, which fell 2.30% from high to low. However, the asset that had the most one-sided trend was the NASDAQ. The NASDAQ is currently trading at a four-week low.

US Consumer Price Index Prompt ‘Risk-Off’ Market Move

The issue for investors is not necessarily that inflation is too high, but that the higher-than-expected inflation reading means inflation will remain above 2% for more years. If inflation remains above 2% for much longer, economists fear that the higher rate could become the new norm, which carries economic risks.

Gasoline prices surged 9.1% during September, accounting for more than half of the monthly increase, while overall energy costs rose 5.2%. Inflation also affected housing, with shelter costs increasing 0.4%, alongside higher prices for airfares, used vehicles, recreation, and education.

Looking ahead, economists expect inflationary pressures to remain elevated, particularly if geopolitical tensions continue to disrupt energy supplies. Higher fuel and transportation costs could gradually affect other sectors, making inflation more difficult to control.

Lastly, markets have seen a surge in demand for bonds after the CPI release, indicating a move towards safer’ assets.

Gold Being Paused By Two Driving Forces

Gold initially fell 1.65% immediately after the Consumer Price Index release, before declining a further 0.28% in the hours that followed. However, since this decline, Gold has risen and fully regained all previous losses. The price this morning is showing a strong upward impulse wave, but is retracing as the European session nears.

The reason for the original decline is that the impact the higher inflation figure has on the Federal Reserve, the US Dollar and bond Yields. Both bond yields and the US Dollar rose to new highs for 2026. In addition, markets are now considering a Federal Reserve rate hike for October.

Rate hikes, a strong Dollar, and high bond yields are known to pressure Gold. This is also one of the reasons why Gold has been in a bearish trend over the past eight weeks. However, the higher inflation reading eventually prompts a ‘risk-off’ appetite. As the ‘risk-off’ sentiment gains momentum, the mood towards gold improves.

Markets are now considering an economic slowdown. The Federal Reserve’s latest Beige Book highlights sluggish consumer spending, limited economic growth across several regions and signs of a softer labour market. Now, with higher inflation and oil prices remaining above $90 per barrel, economists believe a slowdown is plausible.

If employment and economic growth weaken, the US Dollar loses its attractiveness and demand for gold rises. At the same time, the Federal Reserve will not be able to hike rates further to bring inflation down, further supporting Gold.

For this reason, Gold is now correcting upwards, but technical analysts advise volatility in both directions is likely as investors weigh both positive and negative elements.

Image

Investors Dump NASDAQ In Exchange For Safer Assets

While the direction of Gold is less certain due to both positives and negatives, the NASDAQ is witnessing a strong decline. The NASDAQ fell 2.16% on Wednesday and a further 1.25% during this morning’s Asian session. Economists are also saying that there is a direct switch between stocks and bonds.

Investors are decreasing their exposure to the stock market and particularly to the AI trend. Economists are saying that risks are mounting and strong earnings are currently not adequate to offset other risks.

On one side, investors are considering higher bond yields, Fed hikes, high oil prices, and fears over AI security. So far, earnings and economic resilience have kept the market afloat. However, investors now fear an economic slowdown in 2027. As a result, investors are decreasing exposure.

Image
HFM - NASDAQ 10-Minute Chart

For this reason, the NASDAQ is also showing clear bearish indications from technical analysis. The price is trading below key moving averages and the VWAP. Currently, the order flow blocks are also indicating weak demand.

Price action is also indicating a downward trend as the price maintains bearish momentum. However, oscillators are mainly indicating an oversold condition The key support level on the daily timeframe is at $28,866.70.

Key Takeaways:

* Annual inflation rises to 3.7%, while core inflation reaches 2.6%, strengthening expectations of a Federal Reserve interest rate hike before year-end.
* Gold rebounds from its CPI losses as increased safe-haven demand offsets pressure from bond yields and a stronger US Dollar.
* The NASDAQ faces sustained selling pressure as investors reduce exposure to tech stocks amid inflation concerns and weakening risk appetite.
* Inflation, elevated energy prices, and signs of a weakening economy increase concerns about a potential US economic slowdown in 2027.

Always trade with strict risk management. Your capital is the single most important aspect of your trading business.

Please note that times displayed based on local time zone and are from time of writing this report.

Click HERE to access the full HFM Economic calendar.

Want to learn to trade and analyse the markets? Join our webinars and get analysis and trading ideas combined with better understanding of how markets work. Click HERE to register for FREE!

Click HERE to READ more Market news.

Michalis Efthymiou
HFMarkets


Disclaimer: This material is provided as a general marketing communication for information purposes only and does not constitute an independent investment research. Nothing in this communication contains, or should be considered as containing, an investment advice or an investment recommendation or a solicitation for the purpose of buying or selling of any financial instrument. All information provided is gathered from reputable sources and any information containing an indication of past performance is not a guarantee or reliable indicator of future performance. Users acknowledge that any investment in Leveraged Products is characterized by a certain degree of uncertainty and that any investment of this nature involves a high level of risk for which the users are solely responsible and liable. We assume no liability for any loss arising from any investment made based on the information provided in this communication. This communication must not be reproduced or further distributed without our prior written permission.
HotForex is an award winning, fully regulated and licensed online forex and commodities broker. Offers various accounts, trading software and trading tools to trade Forex and Commodities for individuals, fund managers and institutional customers.
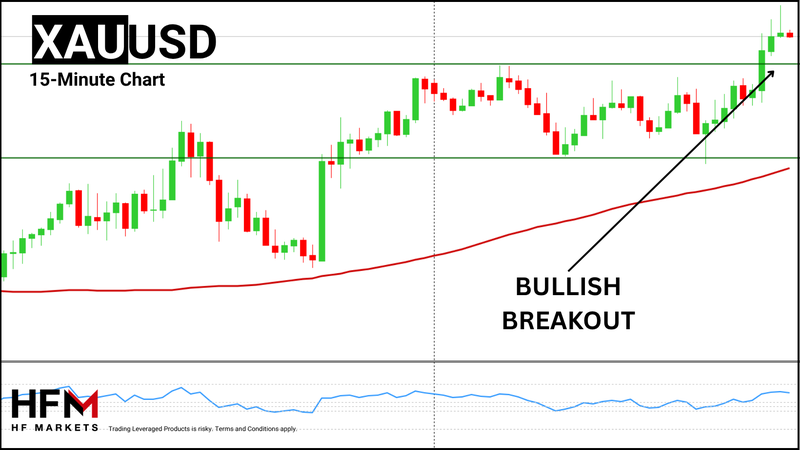
Répondre